Security is often spoken of in absolutes. Is this secure? Is that insecure? The reality is that security is a spectrum. It is a series of implicit and explicit decisions made to meet the business needs within an acceptable risk tolerance.
What is an acceptable risk? How can you determine what threats pose a risk to your work? How likely are those threats to occur? Is there data available to support these determinations?
The answers to these questions are vague at best. This leads a lot of teams to practice security as a set of “best practices” with little understanding of what risk a control or process is supposed to address.
In this talk, we’ll examine the challenge around identifying realistic threats to your work, various risk assessment models, and how to take a reasonable approach to making risk decisions with insufficient data.
Slides

The question of risk really boils down to this, "Will this decision haunt me?"
That is—of course—assuming that you get to make the decision at all!

Very often (especially on the cybersecurity side of things), we are reacting to event beyond our control. Ideally, we are able to assess risk before an event happens.
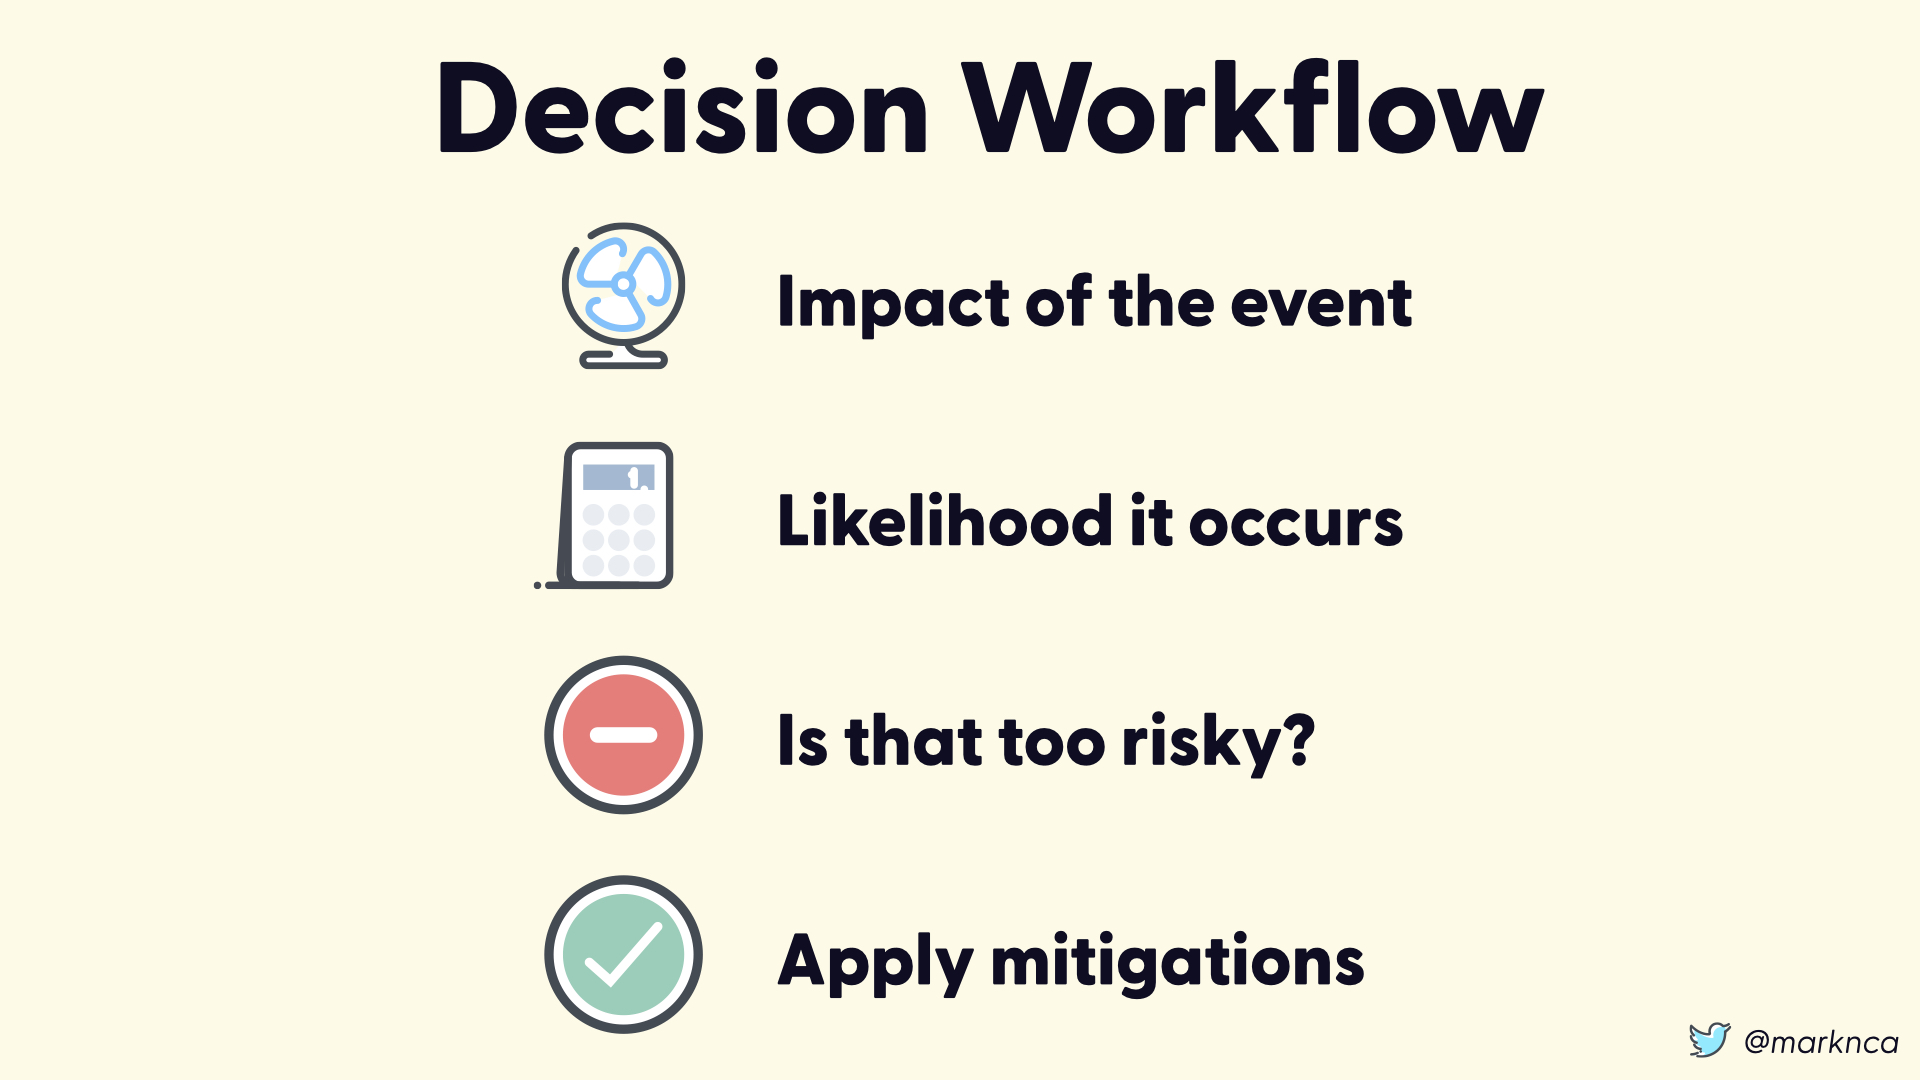
To properly evaluate risk, you need to have two elements. The first is an assessment of the impact of the event.
When **it hits the fan, how bad is it going to get?
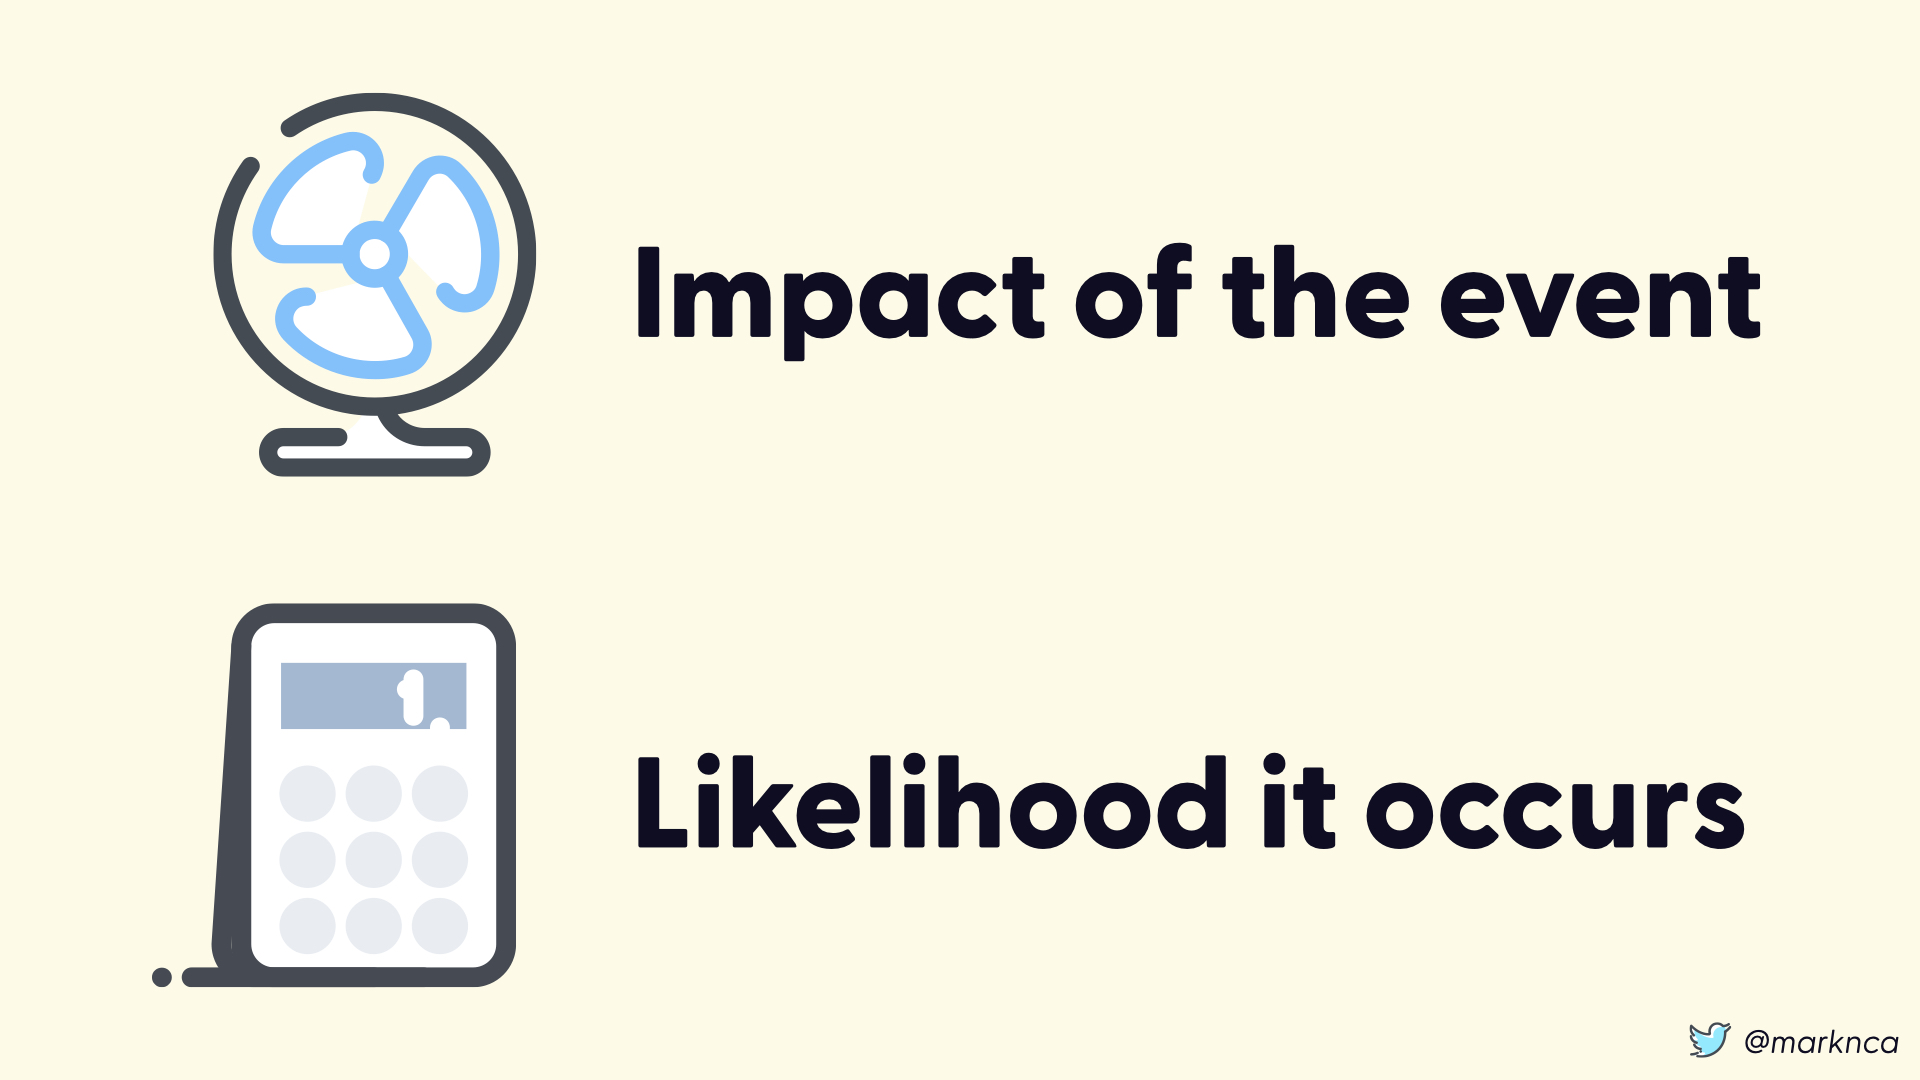
The second aspect of risk is the likelihood that an event will occur.

With a handle on these two aspects, you then have to ask yourself, "Am I ok with this?"
If you are, you're good to go. If not, you need to do something to reduce the risk.

A practical example: crossing the street
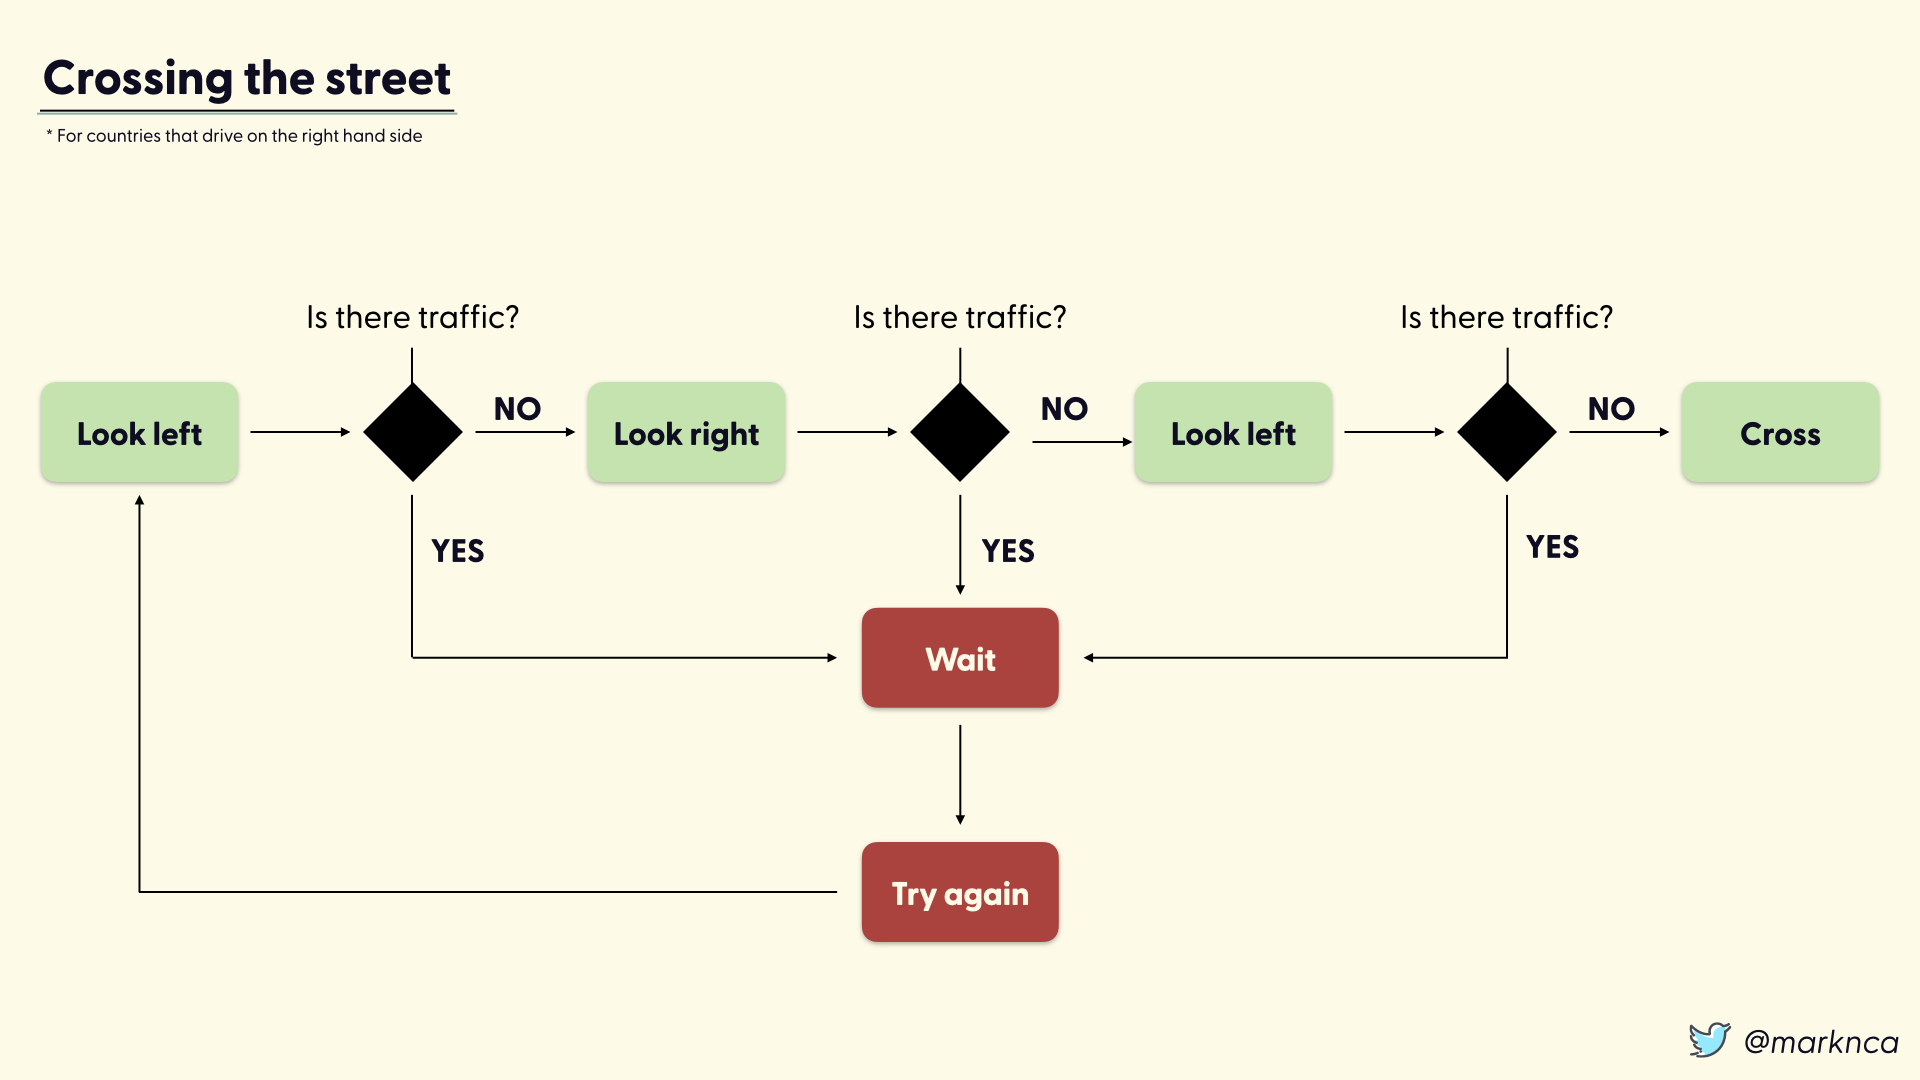
Crossing the street is a relatively simple process. During the process you ask yourself the same question three times, "Is there traffic?". If yes at any point, you wait and retry the entire process.
The process: look left, look right, look left again, then cross.
Flip that for left hand driving countries, but otherwise that's all it takes to cross the street. A very simple series of risk decisions.

It's so simple, that we teach this process to children. In fact, we quickly let children run through this process on their own.

Even though this is a simple process, is it too risky?
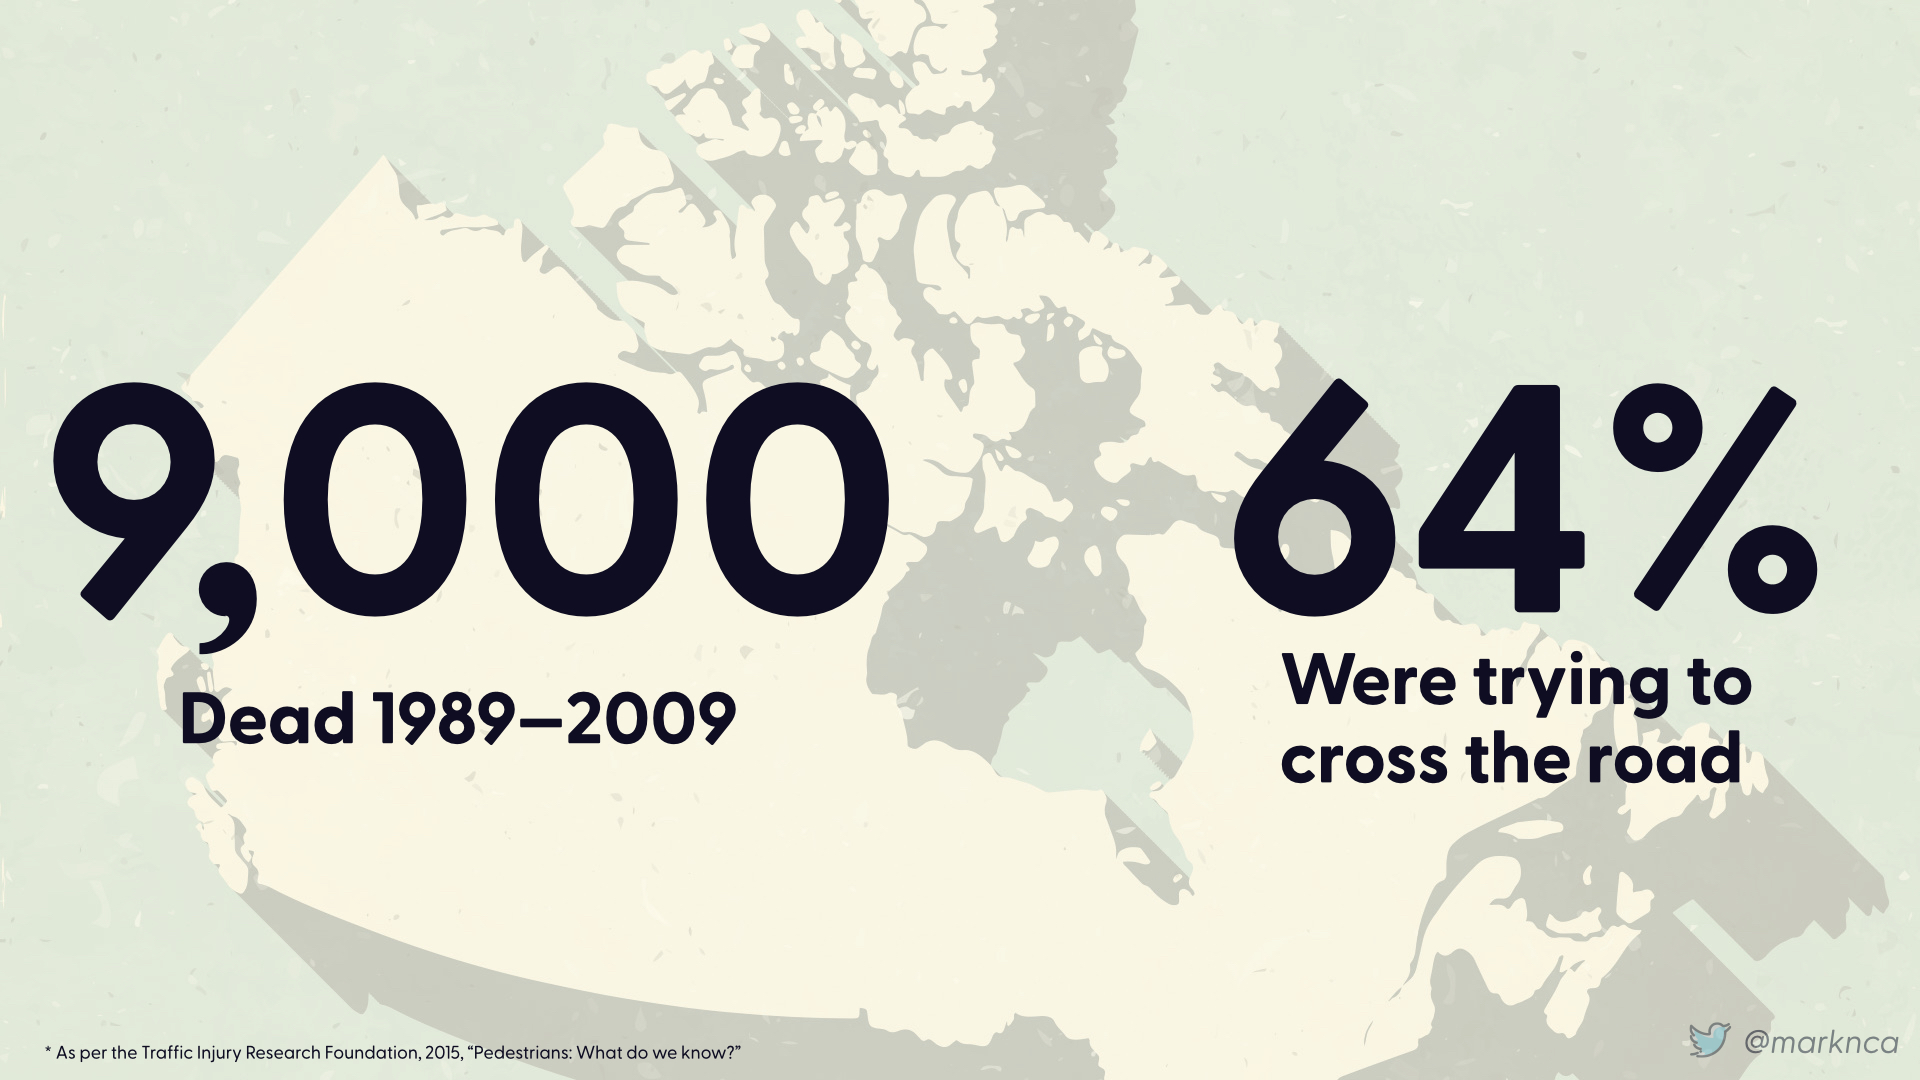
We'll use Canada as an example. In the thirty year span between 1989 and 2009, 9,000 pedestrians were killed.
64% of those pedestrians were trying to cross the road.
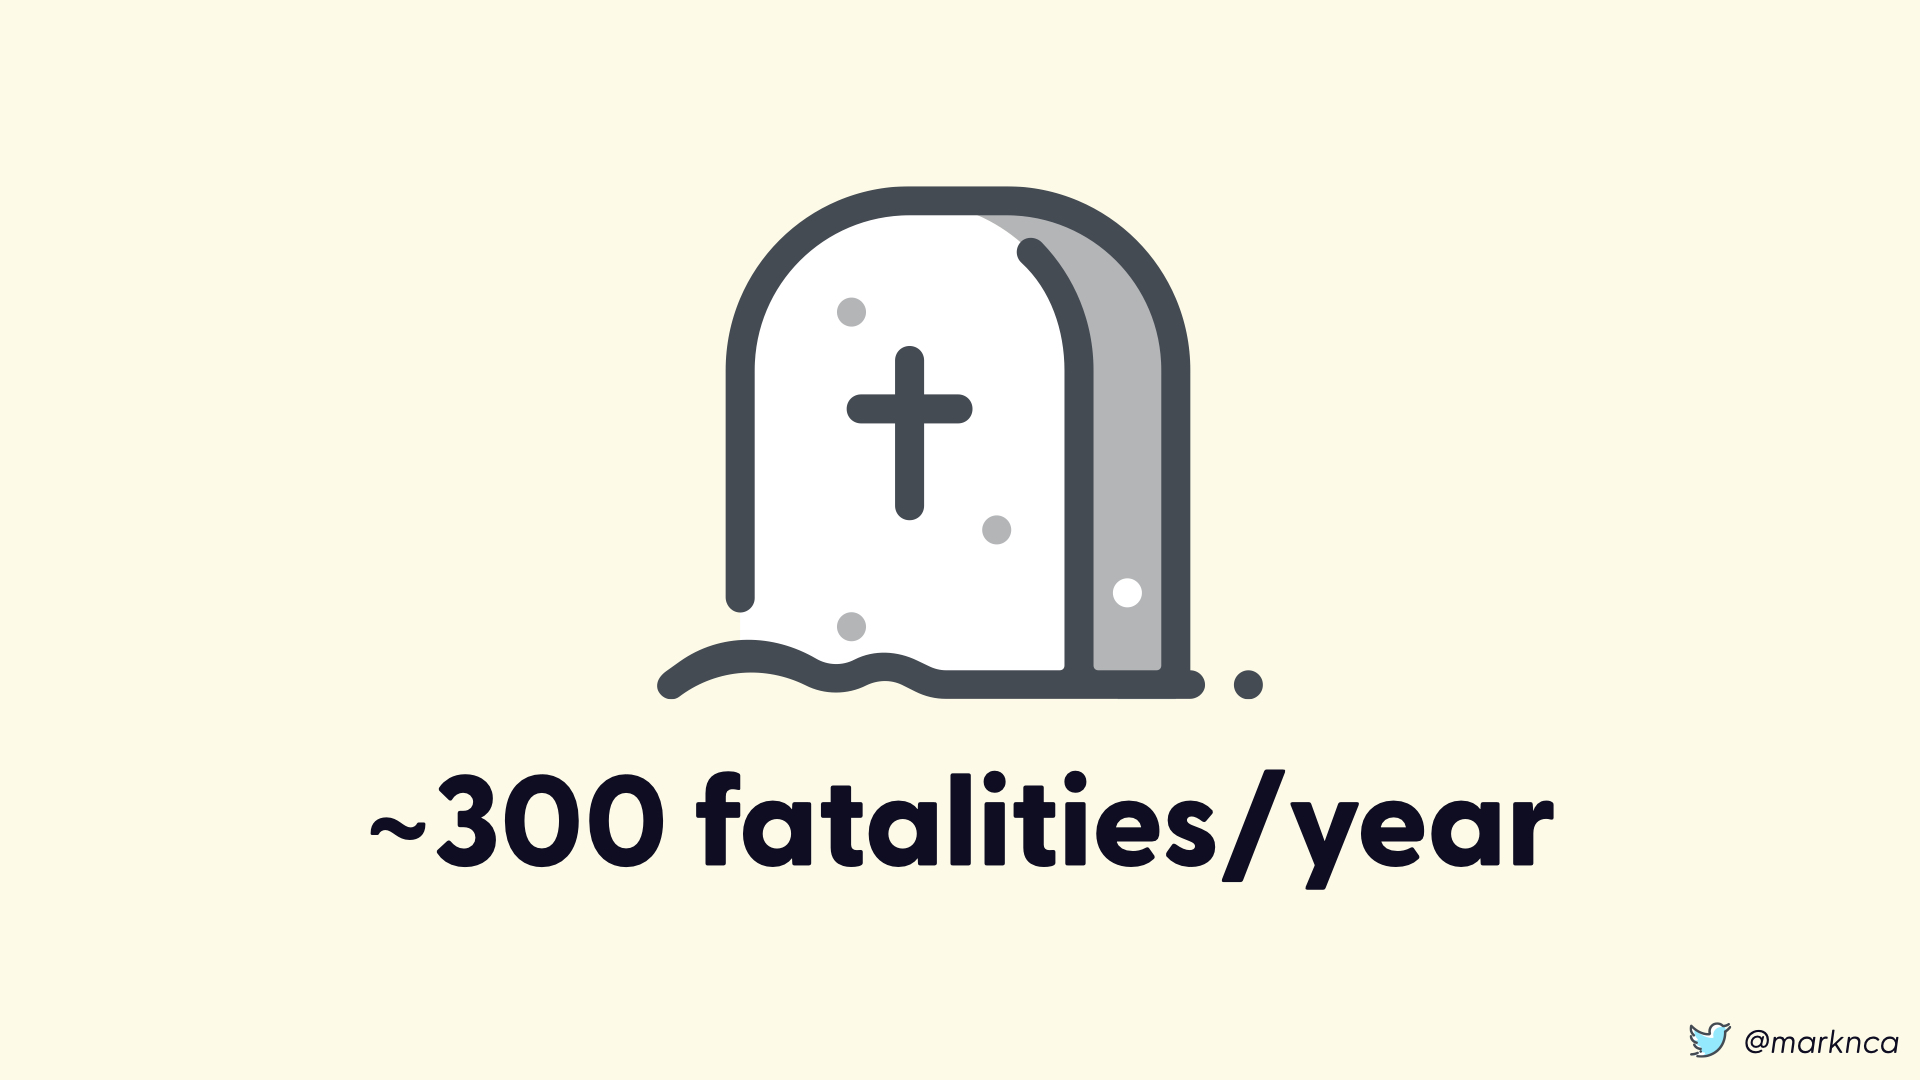
That is approximately 300 fatalities per year.
Given that the impact is the lose of a human life, as a community, we want that number to be as low as reasonable.

To do that we implement a series of mitigations. Or steps to reduce the identified risks.
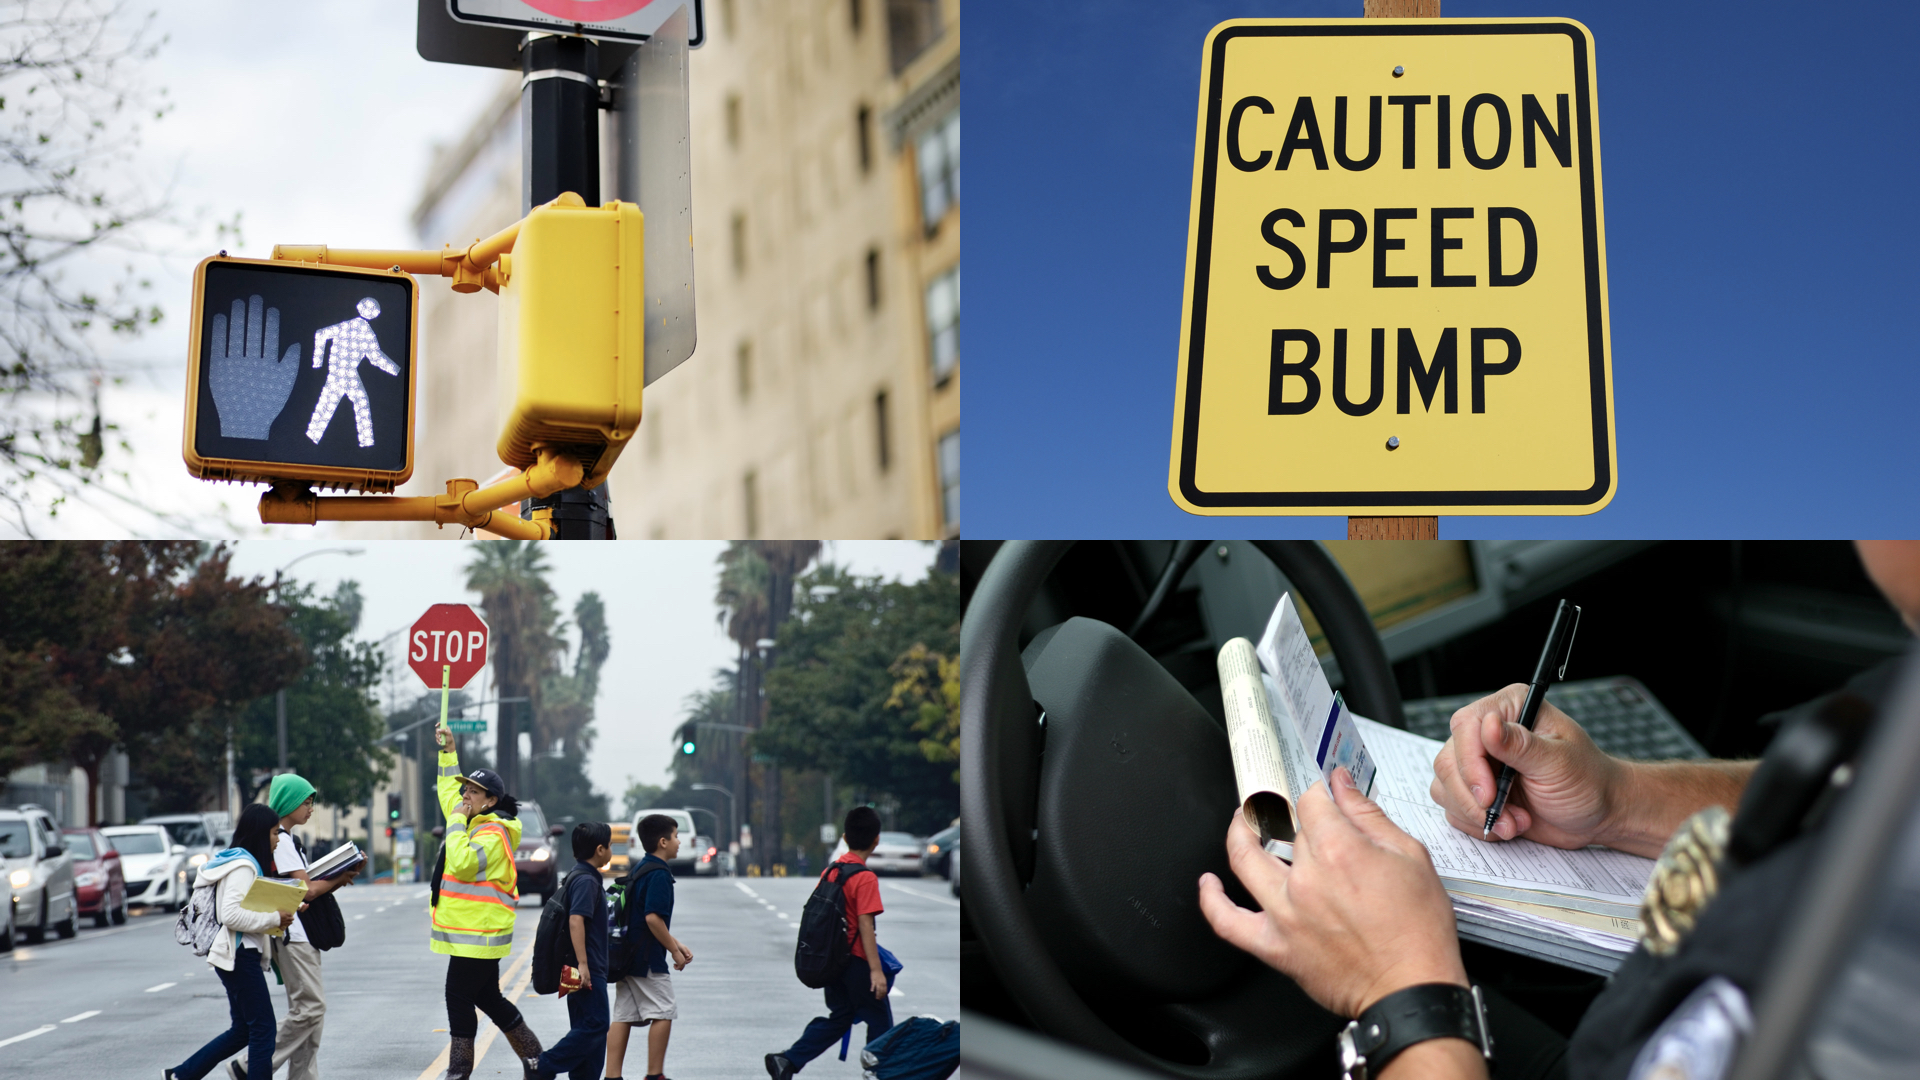
Adding pedestrian lights at busier intersections (often with full traffic lights) helps reduce the risk by controlling the timing of pedestrian crossings.
Additional steps such as audio cues for accessibility and countdown timers help this mitigation to be more effective.

In higher risk areas—like schools—adding a crossing guard further reduces risk.
Here, a trained adult in highly visible clothing, helps younger people through the steps of the risk decision. It's a direct mitigation where the problem is more frequent.
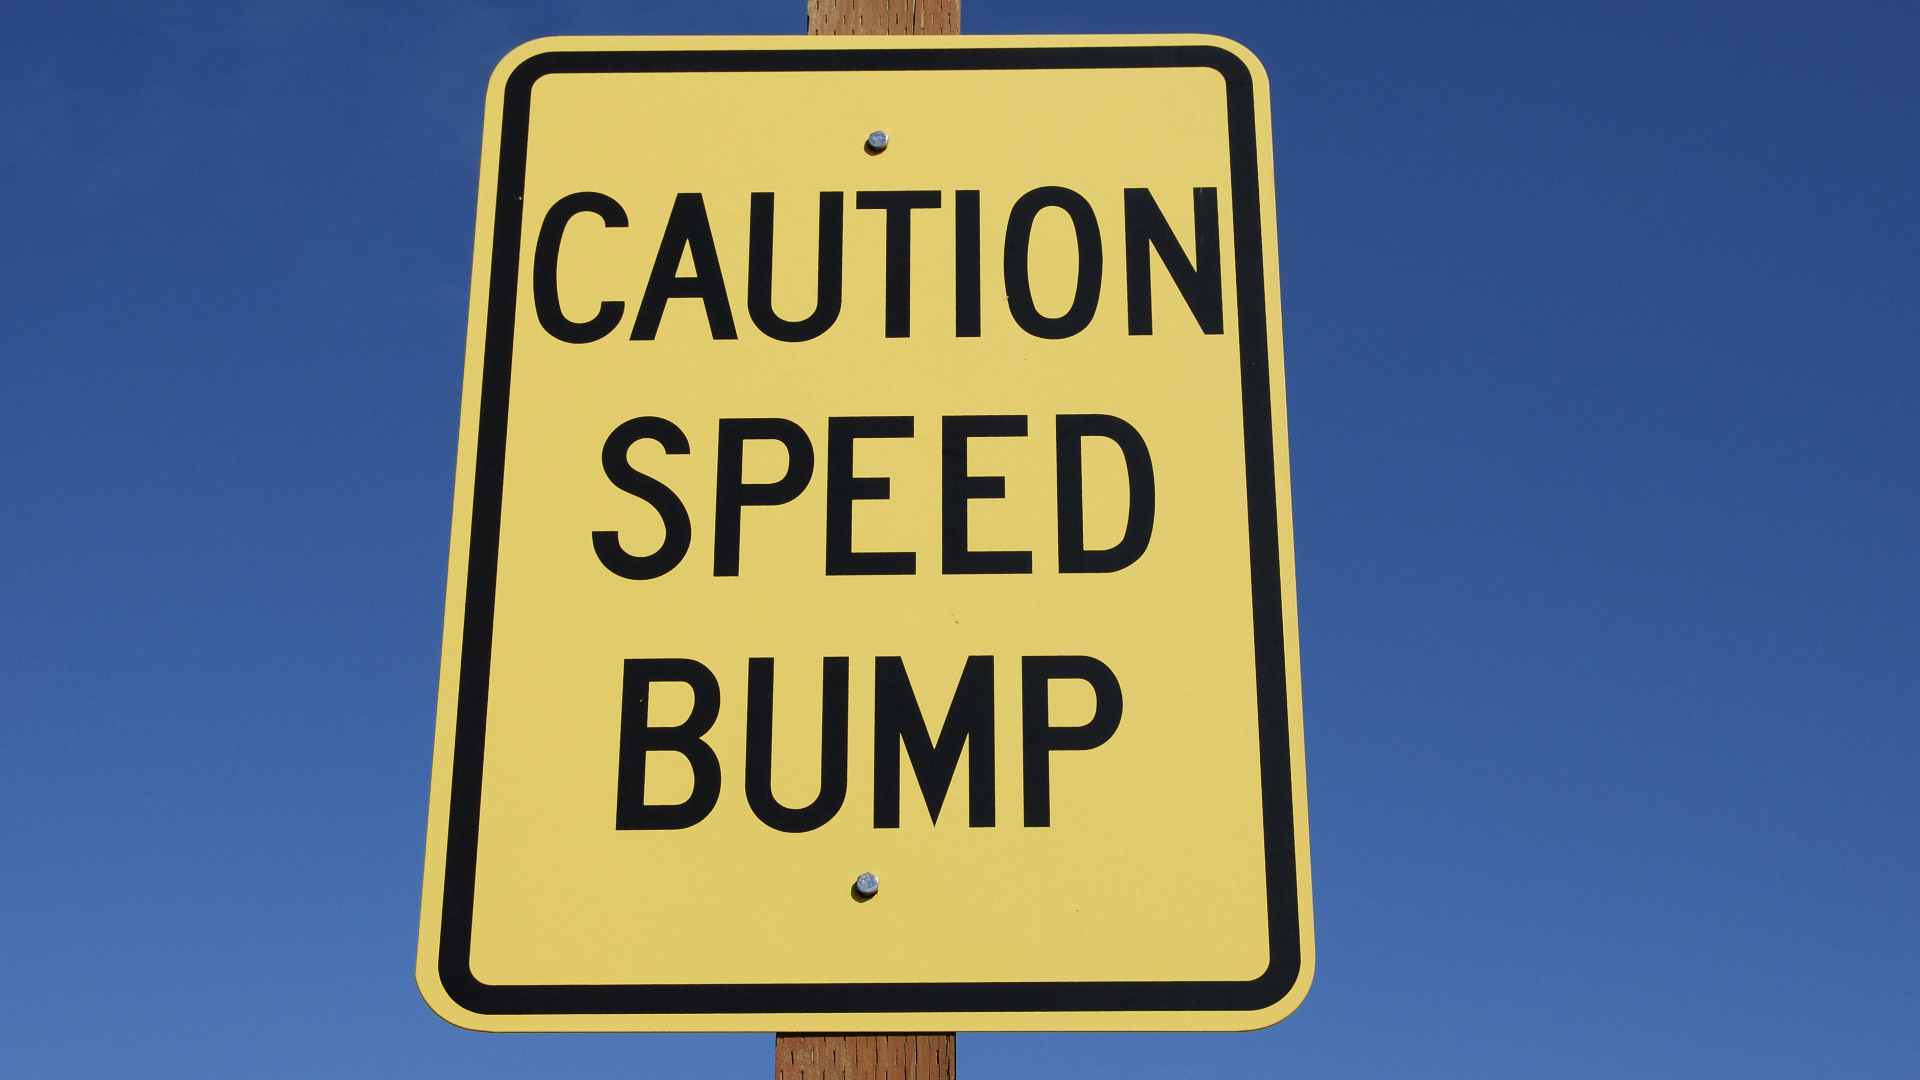
Other mitigations include adding speed bumps and other traffic calming measures. Here the approach is designed to change the behaviour of drivers.
These mitigations work on the other half of the equation: the vehicles hitting the pedestrians.

Increase fines and more stringent enforcement is another strong mitigation. Ensuring that drivers are aware of the issue and the consequences for their actions is a strong trigger for behavioural change.
Taken together along with other commonplaces steps in our communities, these mitigations should reduce the impact and likelihood of pedestrian fatalities.

Let's jump ahead to 2017 to see the positive results...

In 2017, there were still around 300 pedestrian fatalities in Canada.
So what's going on here?
To find out, we need more data.
We won't be able to get a complete data set but we definitely need more data to put this number in context. Up until this point, we've only been using one metric; fatalities per year.
That's not enough to get a clear picture of what's going.
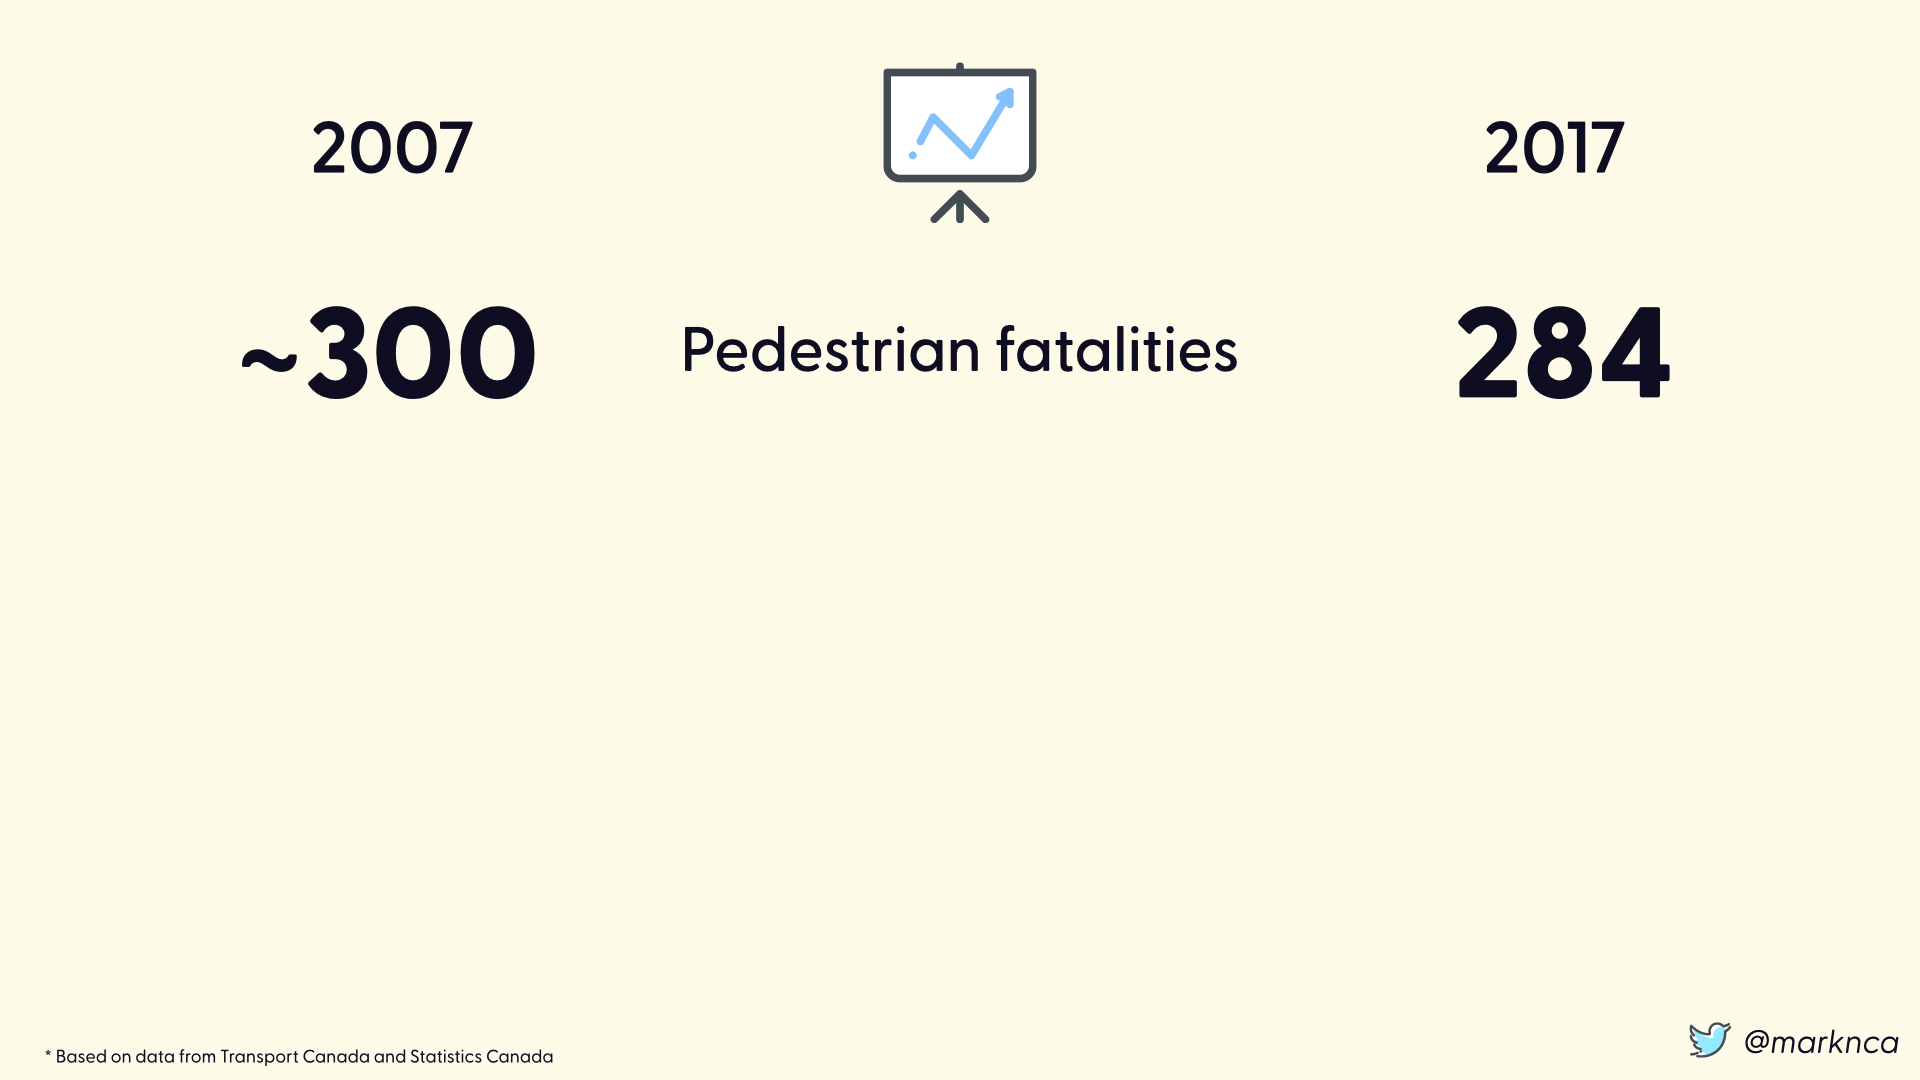
Let's look at the difference between 2007 (in our original 30 years data set) and 2017 (a year where we have detailed information).
These data points are coming from Transport Canada and Statistics Canada. They are accurate enough to provide the perspective needed.
In 2007 there were approximately 300 fatalities. In 2017, there were 284. Within the margin of error for the 30 year average to say that they were essentially equal.
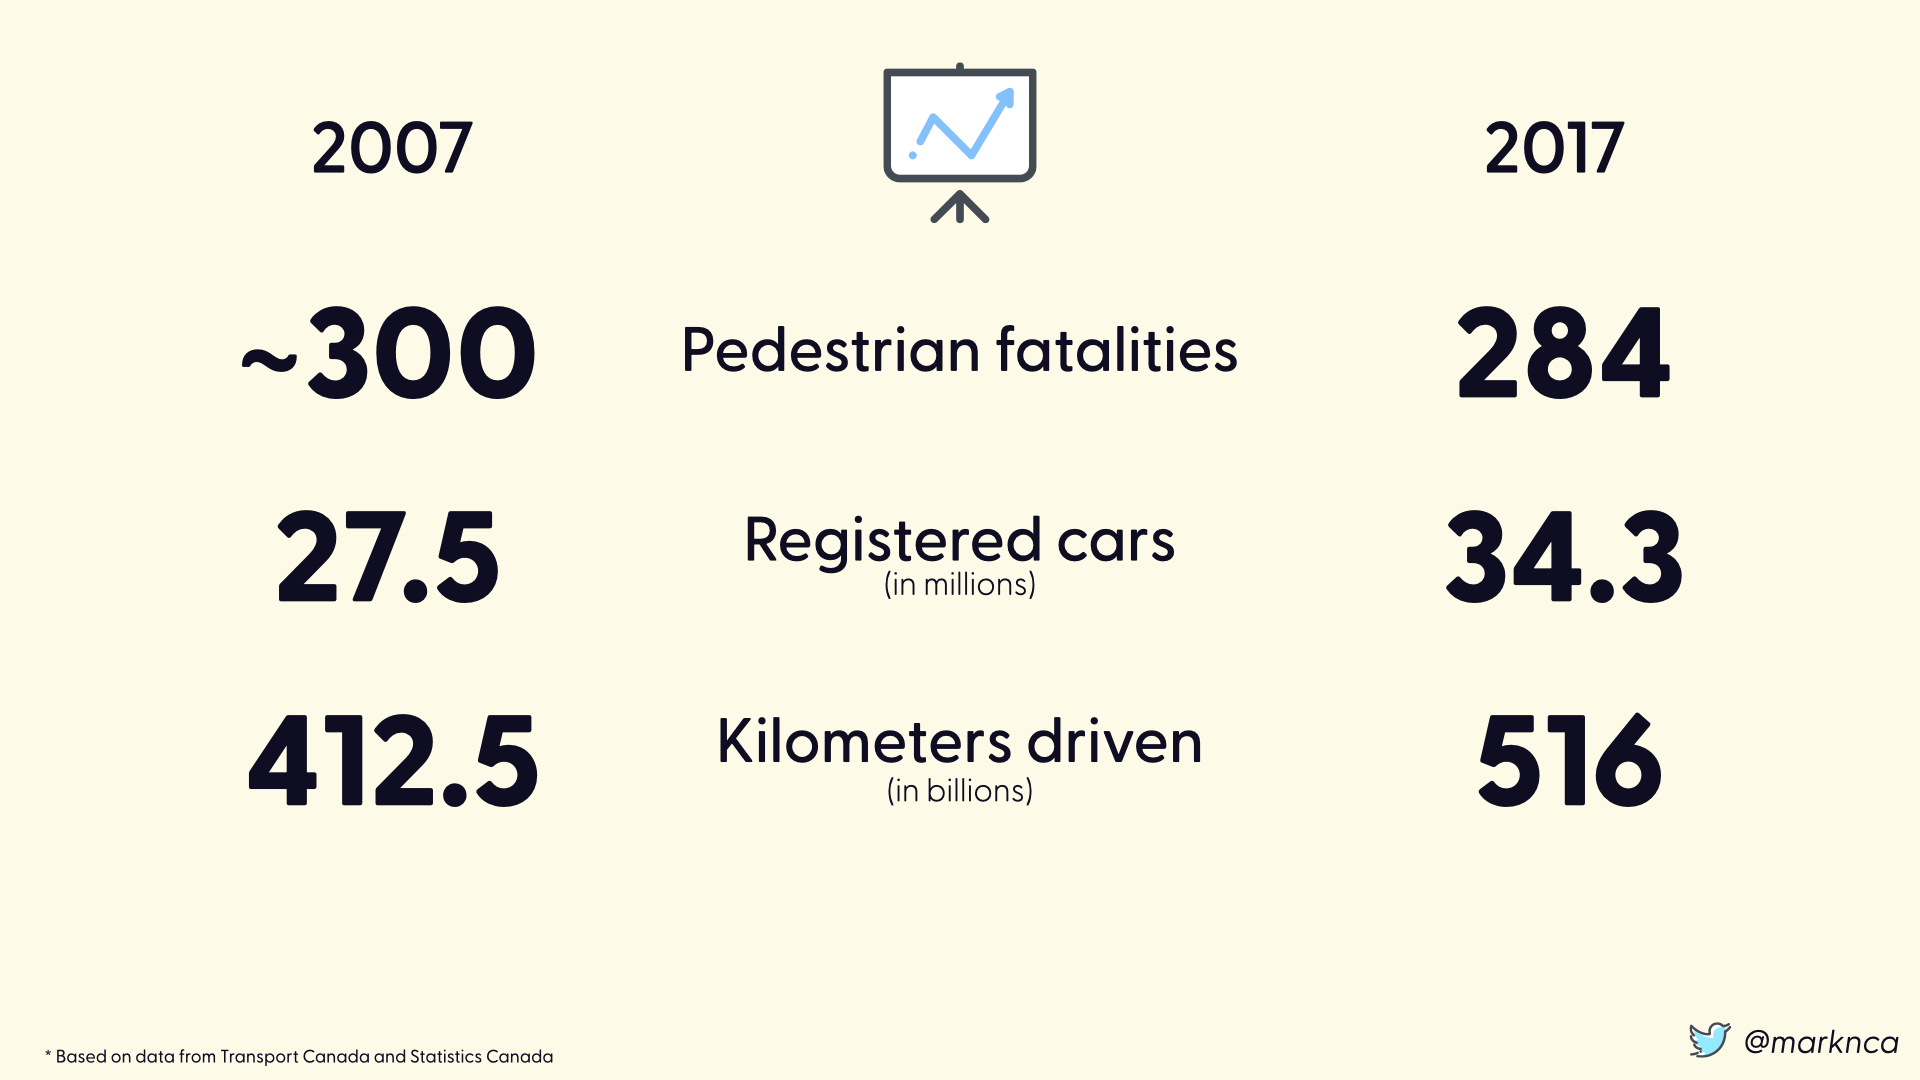
Providing more context to our fatalities per year metrics is the volume of vehicles registered in the country. In this case, there was a 6.8 million vehicle increase over the decade.
Additionally, there was a 103.5 billion increase in the number of kilometers driven between the two years.
Taken together, these numbers help fill in the gaps. Ideally, we would have the number of pedestrian trips as a metric. If there 285 pedestrian trips in 2017, 284 fatalities is a massive problem. If there were 284 million trips, 284 fatalities is a very, very small percentage.
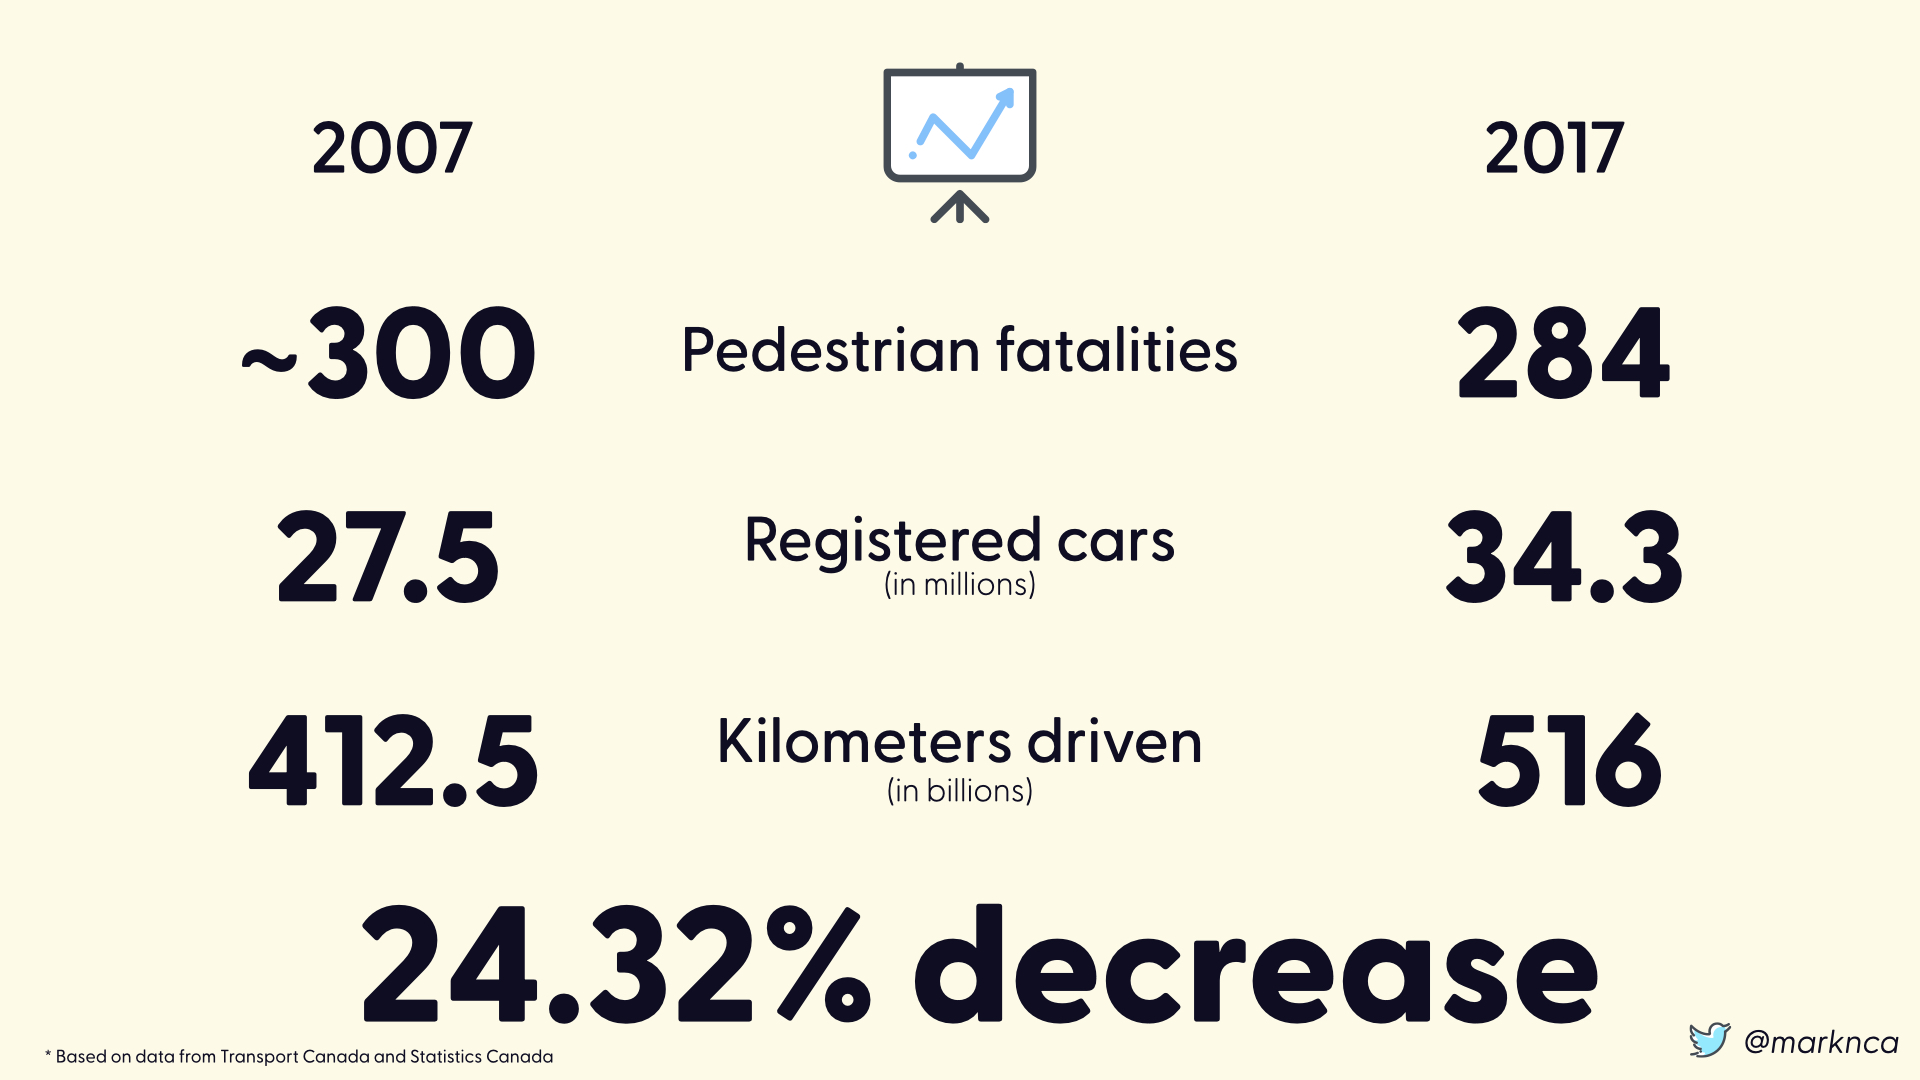
Using the numbers we have (a key to risk decisions in an imperfect world), we can see that the mitigations put in place results in a 24.32% decrease in pedestrian fatalities given the volume of kilometers driven.
That's a significant improvement.
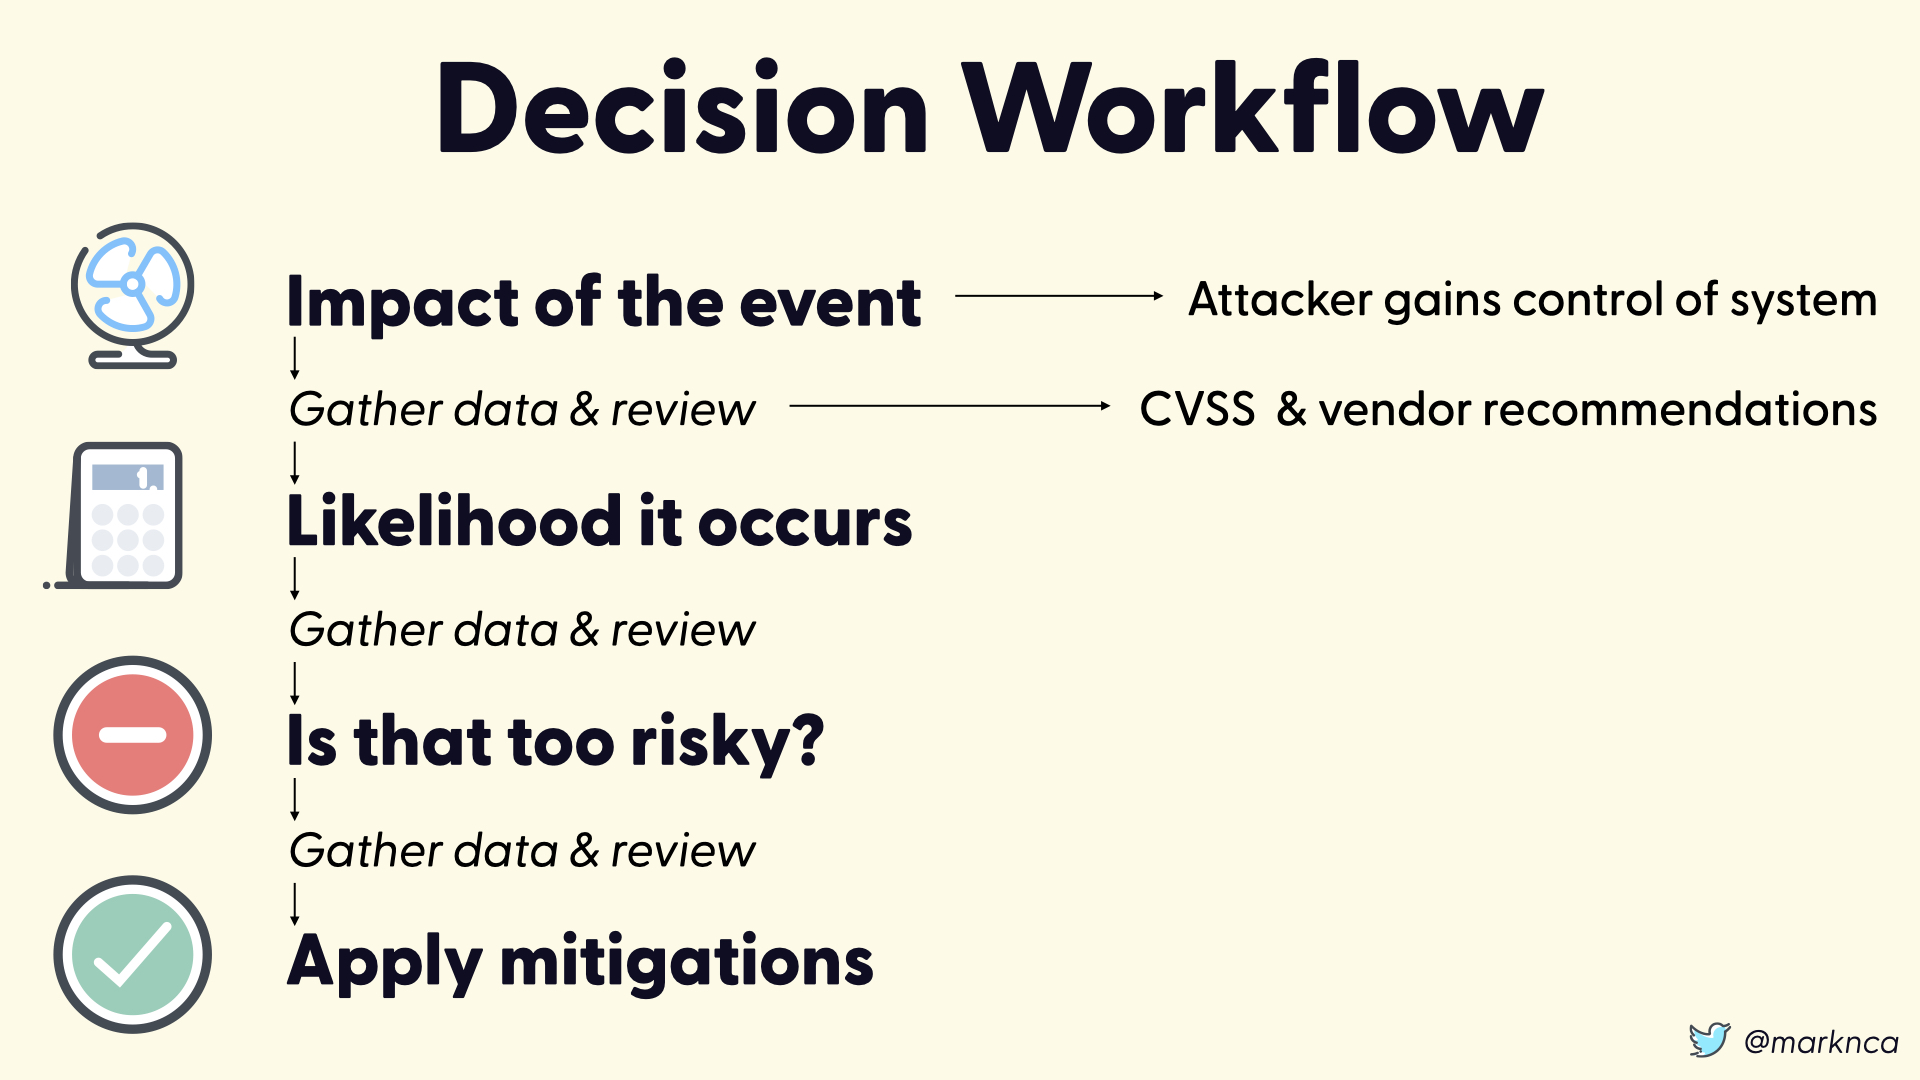
If we step back and look at our workflow, we have the following steps:
- Determine the impact of the event
- Determine the likelihood that the event will occurs?
- Is that risk acceptable?
- If no, apply mitigations until it is an acceptable risk
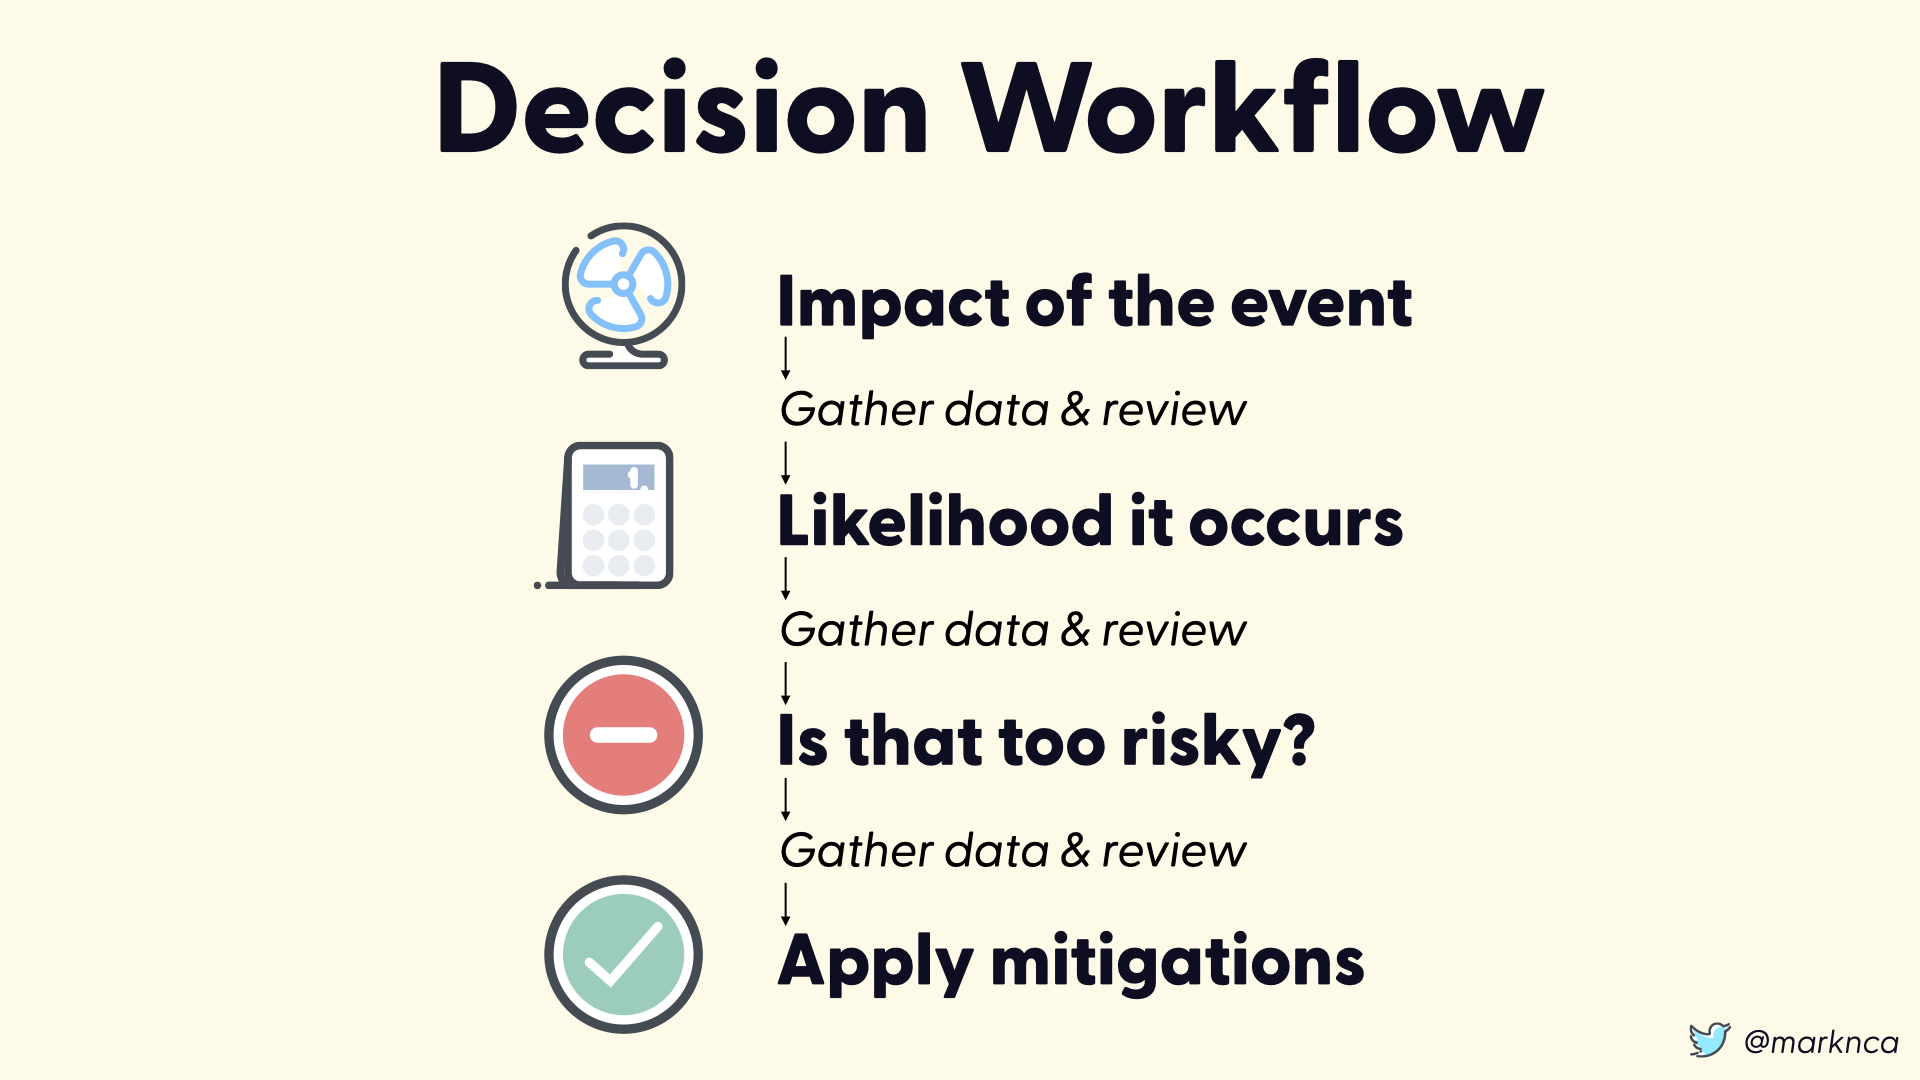
But that process isn't complete. Between each of the steps we need to gather data and review it.
Do we have the data to support our decisions at each point? Is the quality of the data acceptable?

Cybersecurity Risk Decisions
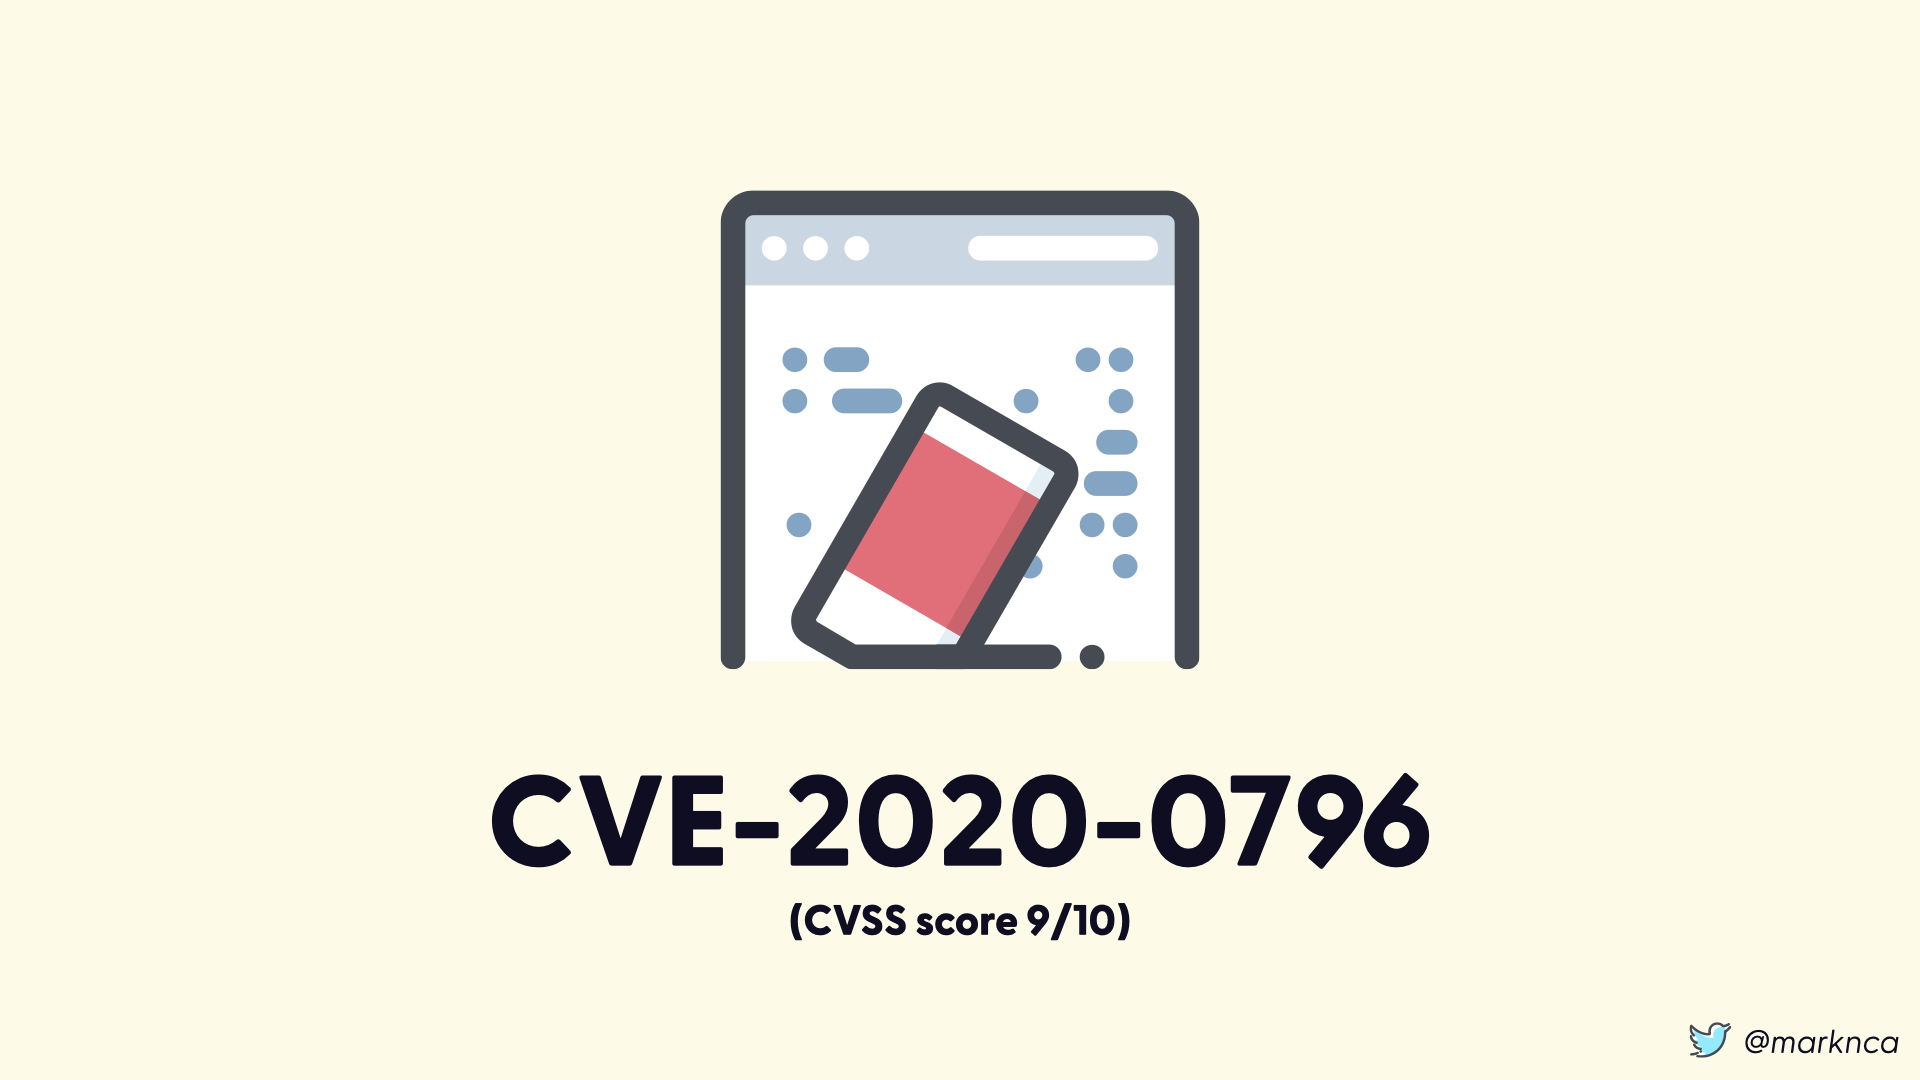
Let's walk through a real world example. The glamorously named "CVE-2020-0796".
This Windows vulnerability has a CVSS score of 9 out of a possible 10.
That's bad.
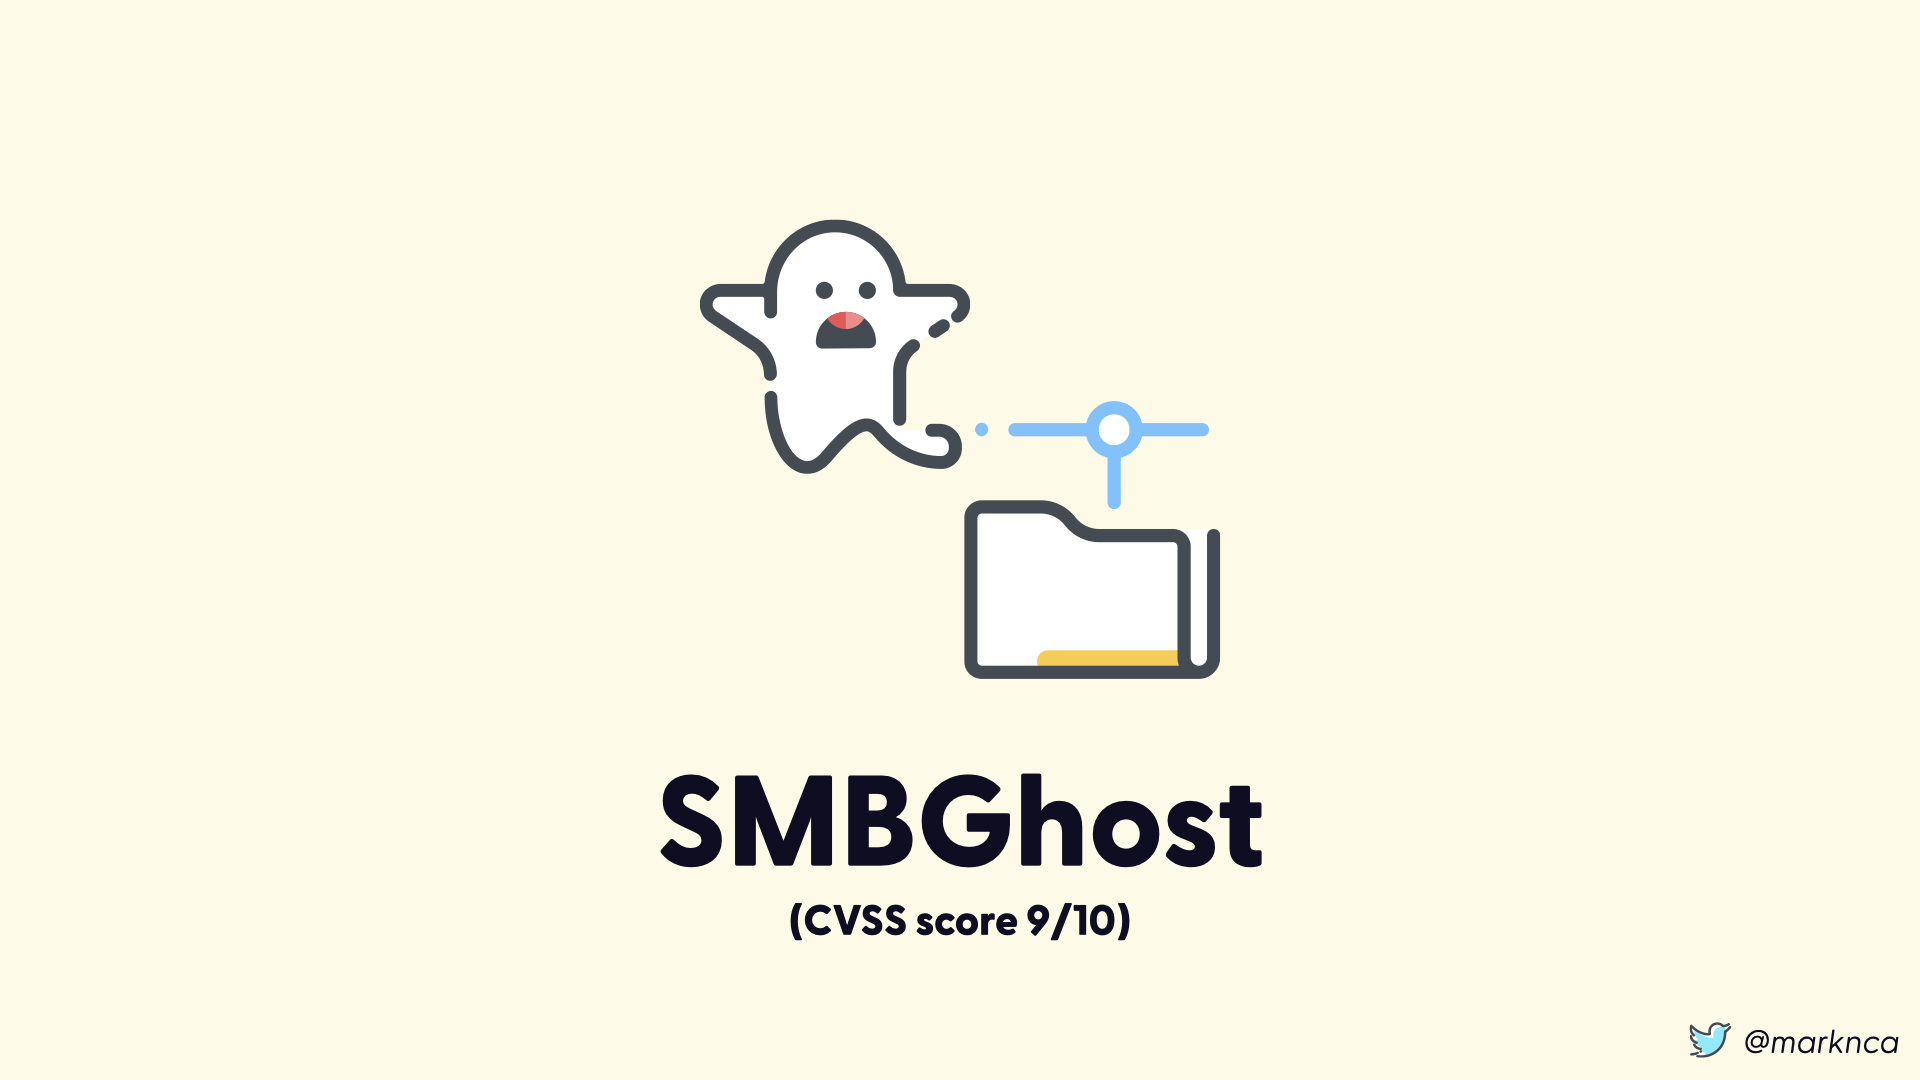
The nickname for this vulnerability is "SMBGhost". This vulnerability was odd from the get-go. It was leaked during the disclosure process which added to the intrigue.
The challenge is taht this vulnerability is very similar to the one exploit by WannaCry. A massive cyber attack in 2017 that grabbed headlines worldwide.
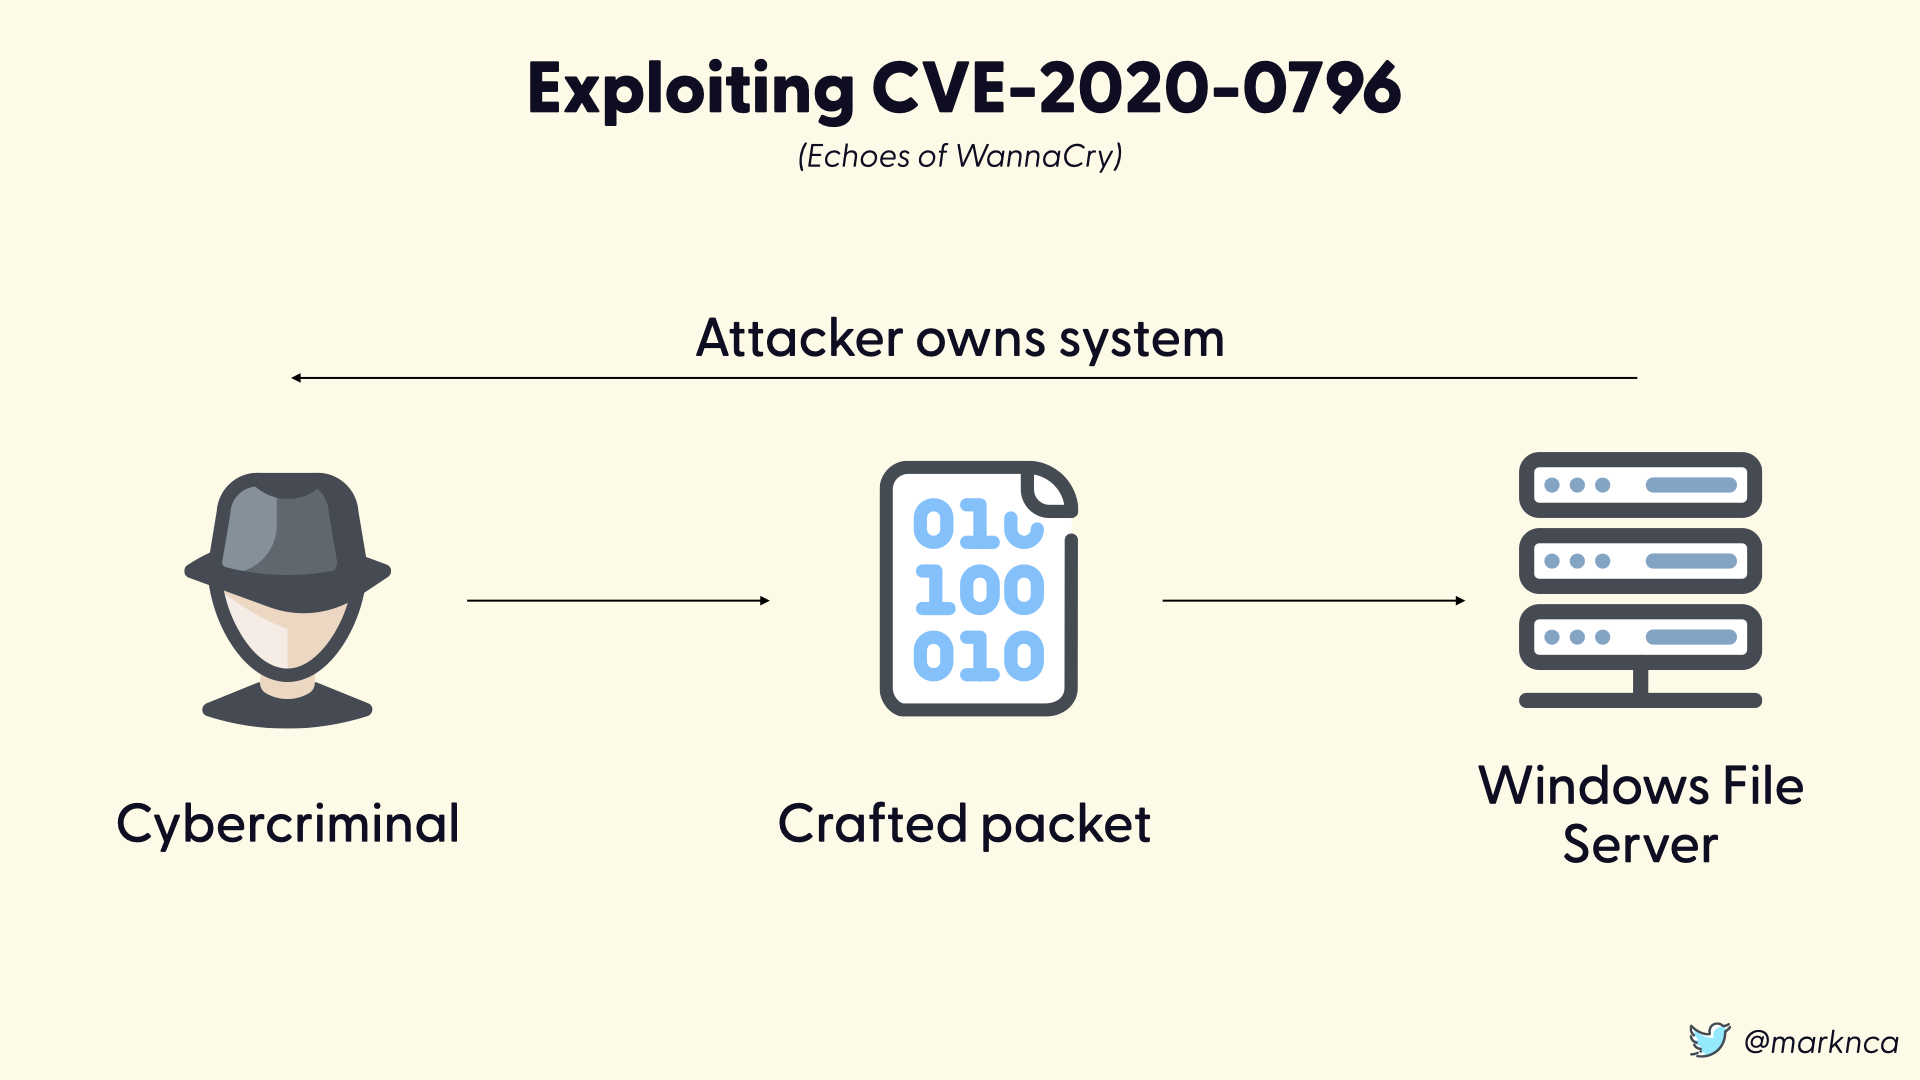
To exploit this vulnerability, a cybercriminal can send a specially crafted network packet to a vulnerable Windows file server and execute their own code. This is called a remote code execution attack.
This is bad.
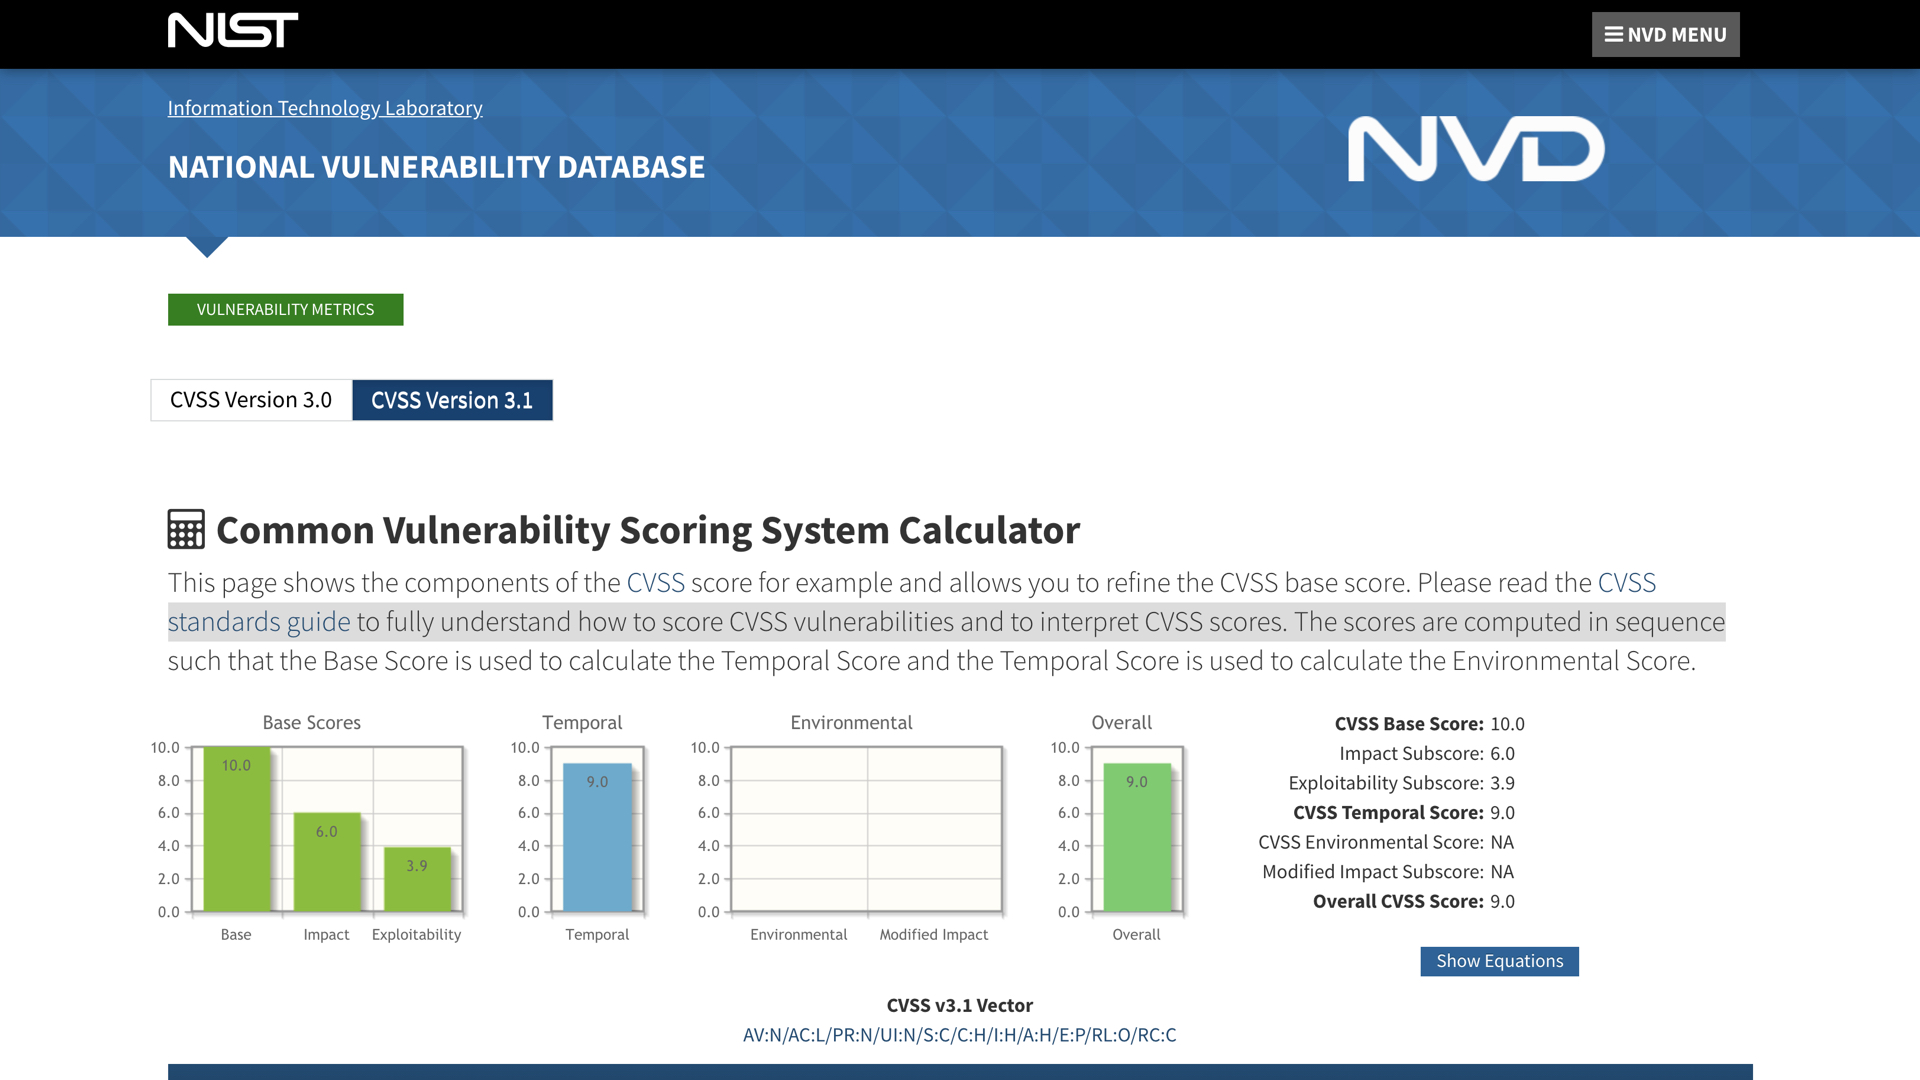
The NIST National Vulnerability Database has the details for CVE-2020-0796. It lays out some of the assessment information for this vulnerability.
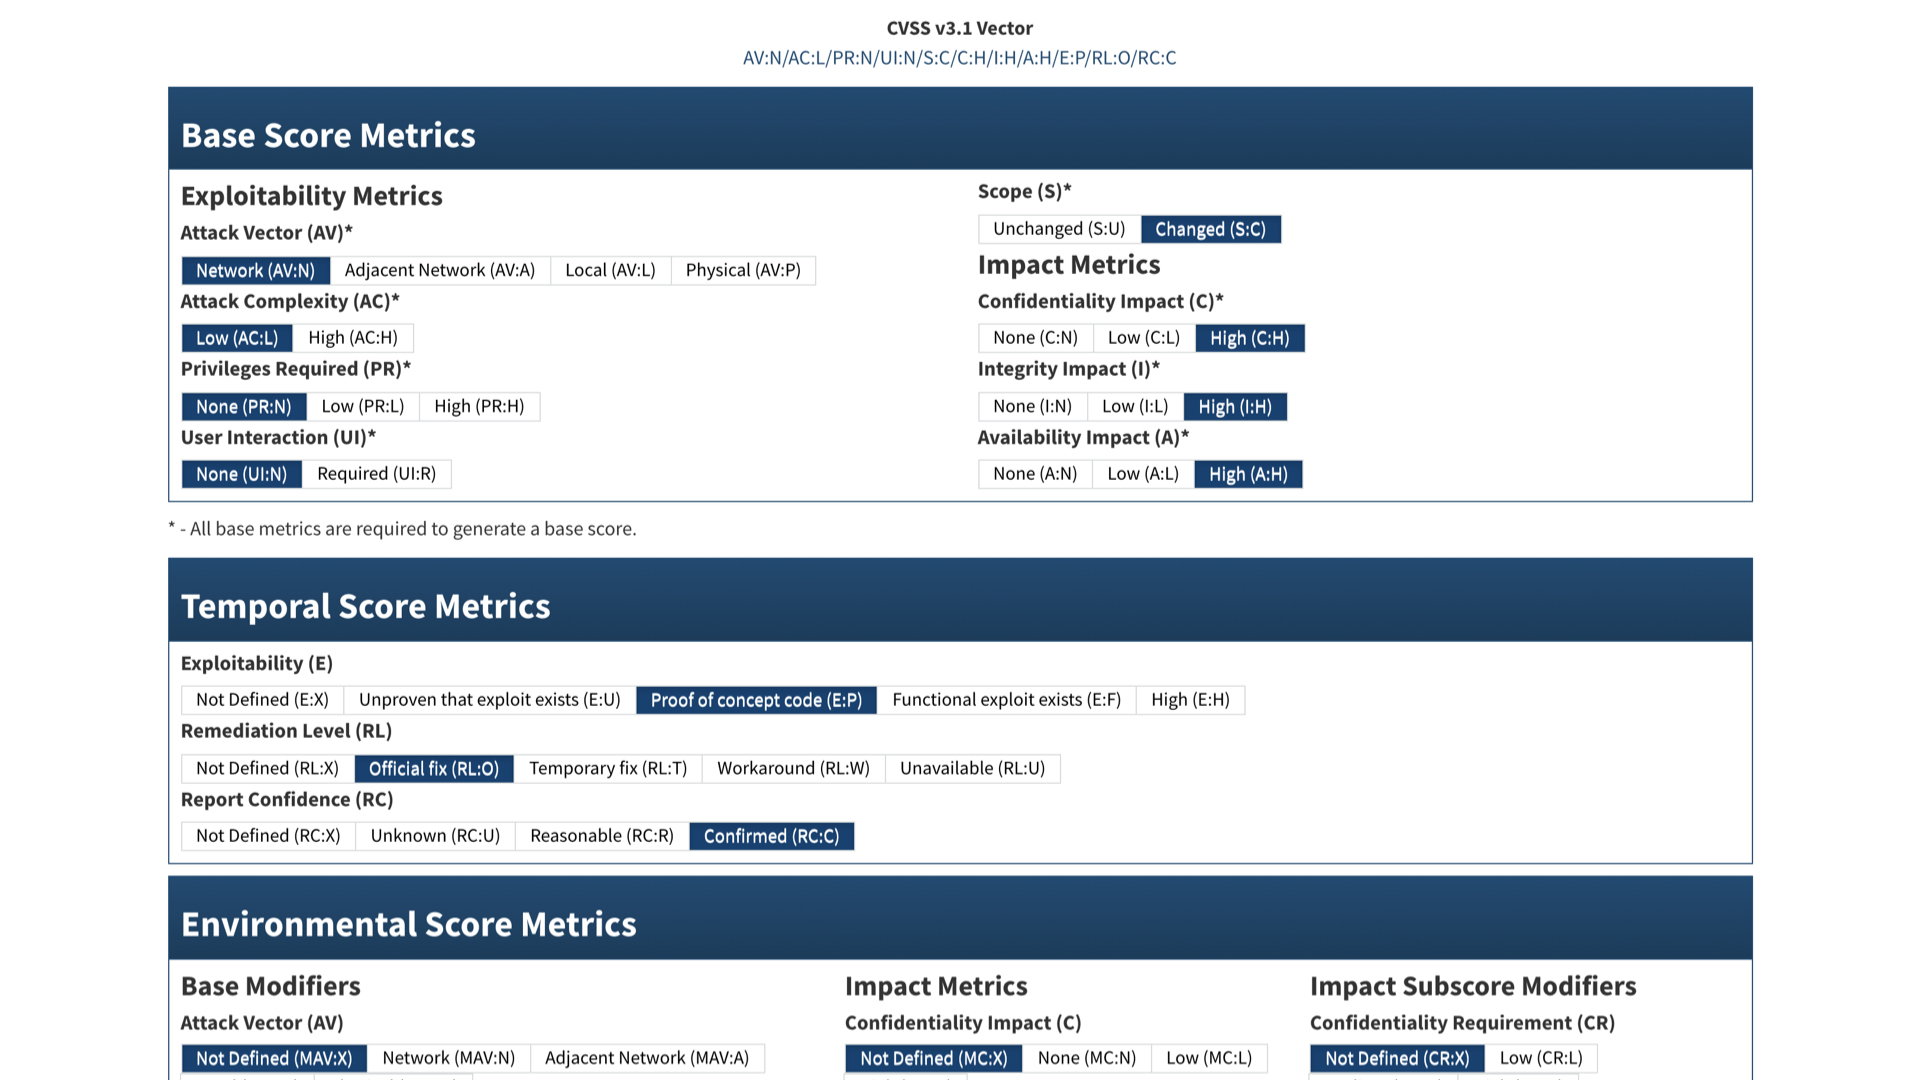
The exploitability metrics are scary. This vulnerability can be exploited remotely, isn't very complicated, doesn't require privileges, and doesn't need the victim to do anything.
This is bad.
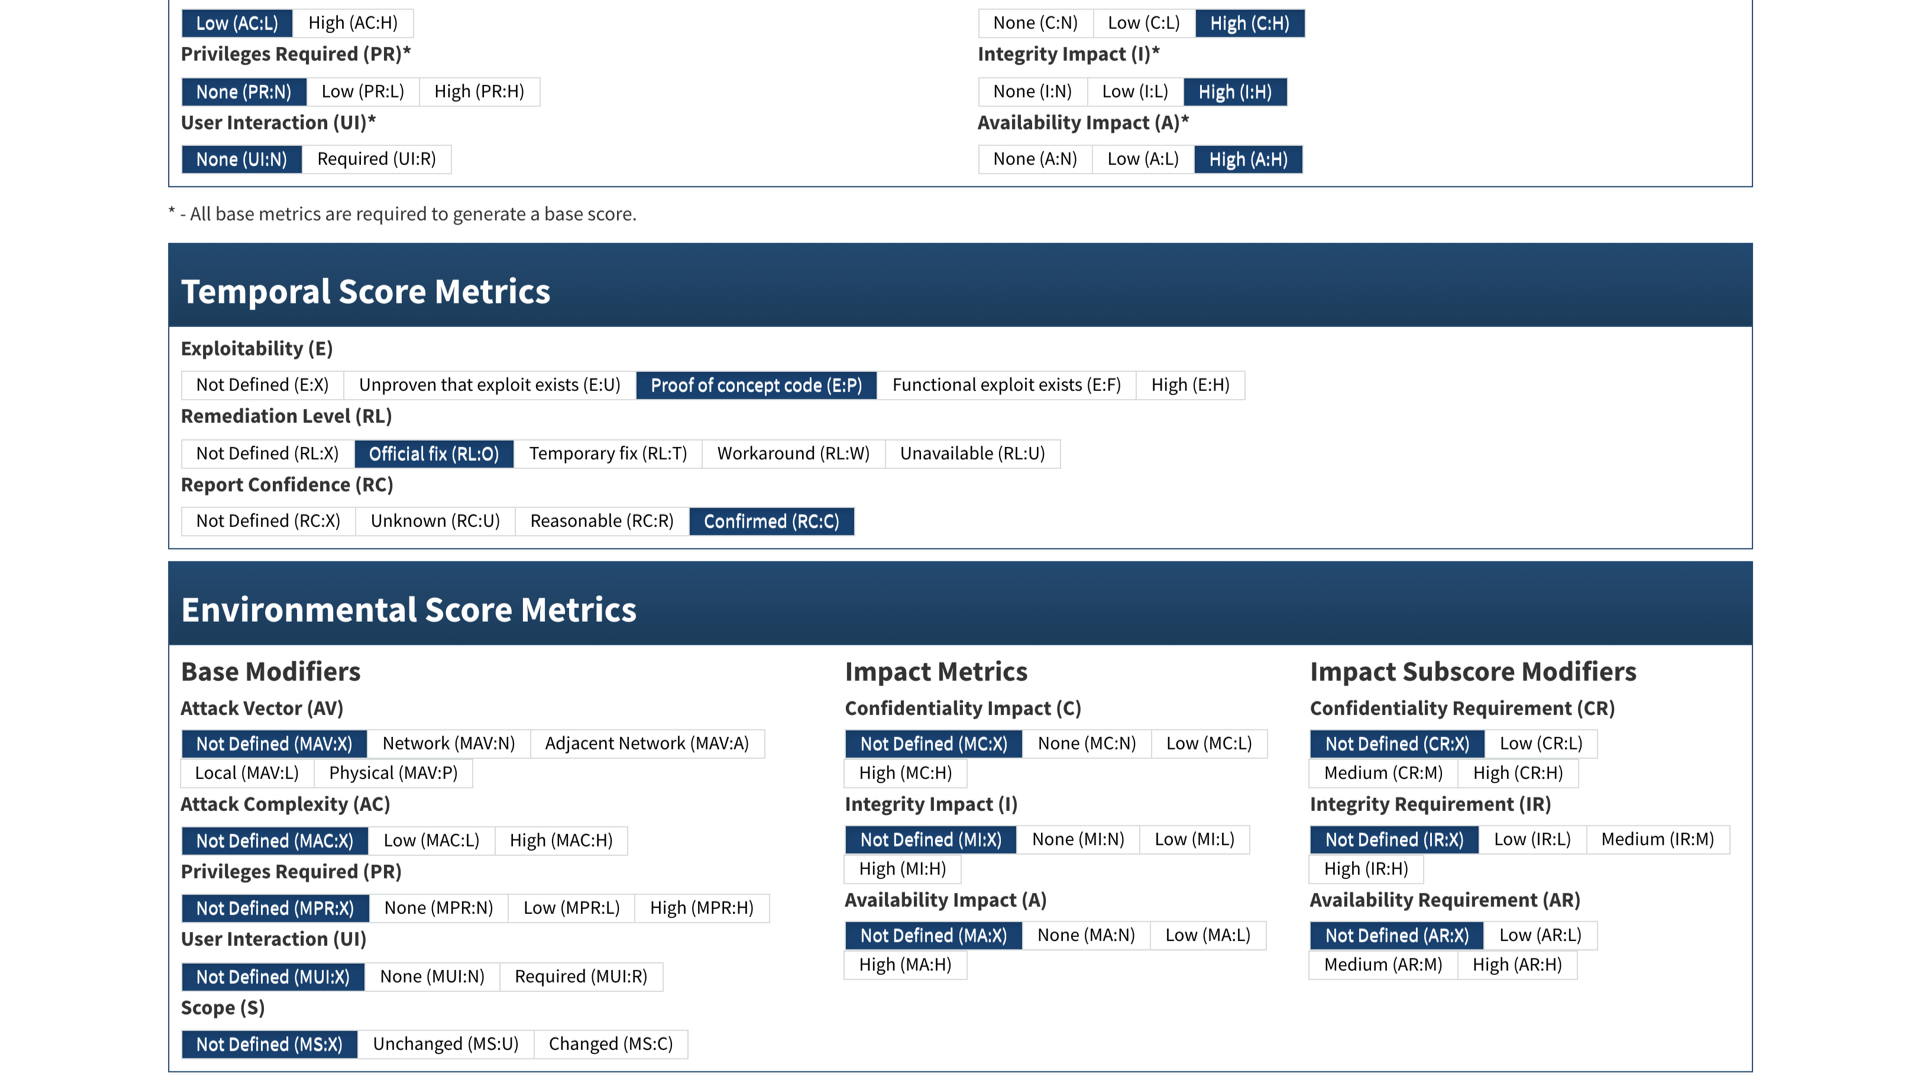
We see in the temporal score that there is a proof of concept available. This usually means that cybercriminals have a working exploit. They are typically a few steps ahead of defenders.
The good news? There's an official fix available.
Is CVE-2020-0796 too risky to leave in your environment?

Security teams will almost immediately tell you that you need to patch immediately. This is a serious issue that needs to be address ASAP.
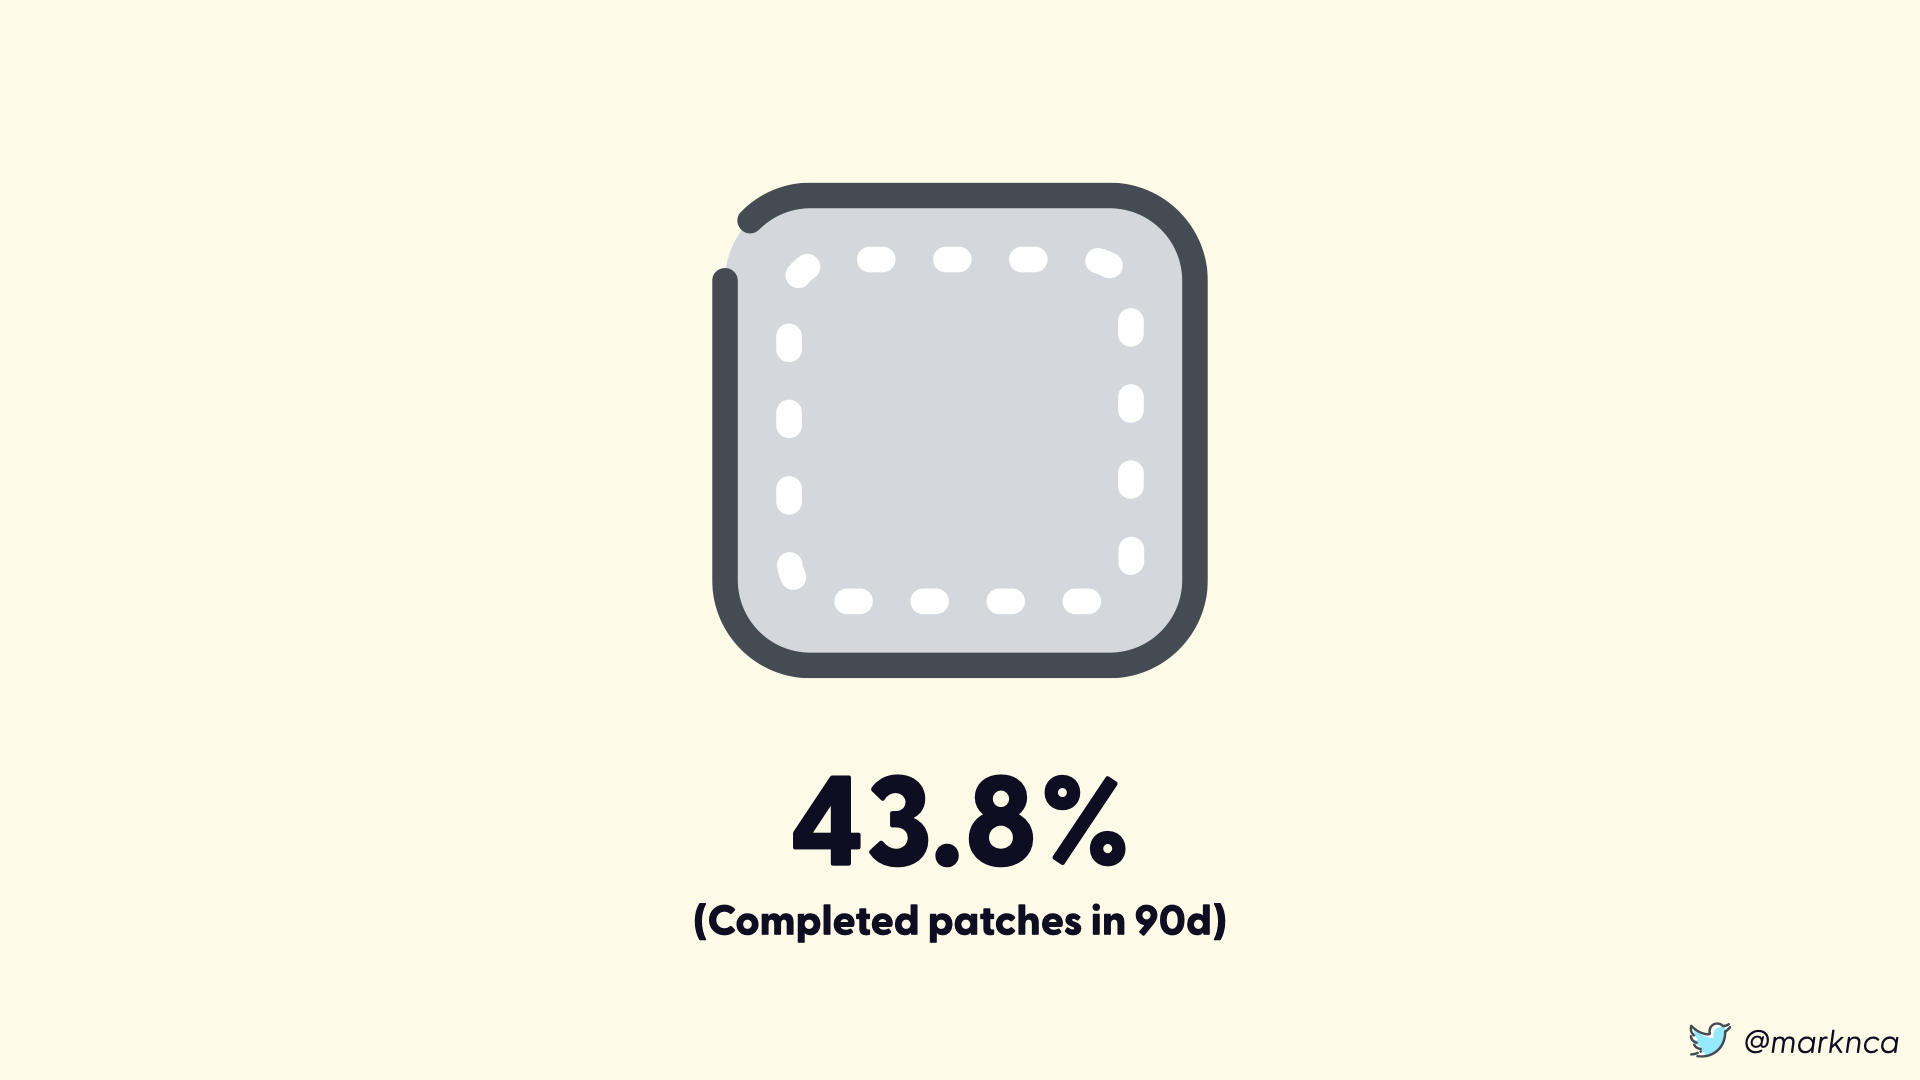
But, organizations aren't great at patching.
According to the 2019 Verizon DBIR, 90 days after an organization starts to patch a vulnerability only 43.8% of the affected systems are patched.
This is bad.
Let's pause and walk through out risk decision workflow.
The impact of this event (someone exploiting CVE-2020-0796) is serious. At attacker will gain control of the impacted system.
We know this because of the data we've gathered from the CVSS analysis and vendor recommendations (not shown 😉)
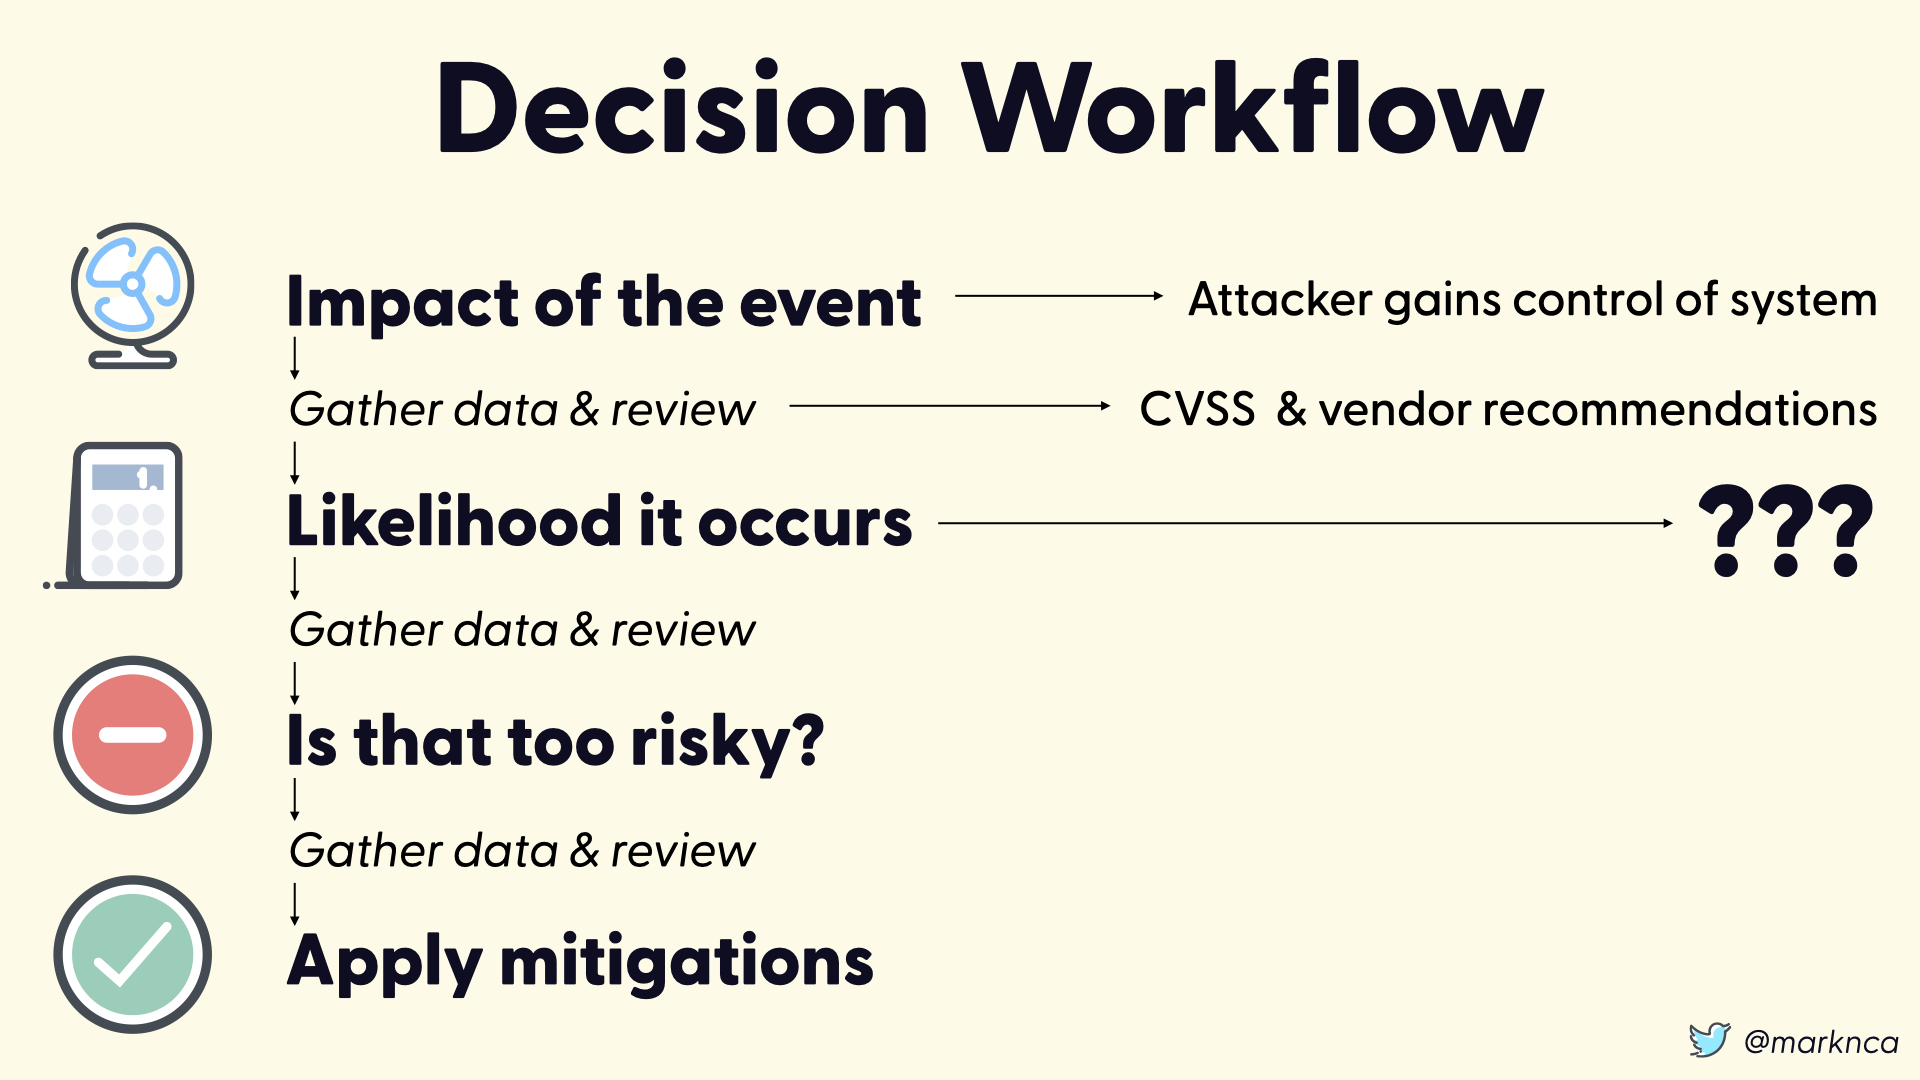
Moving on to the likelihood of the event occuring.
Here where have no data. None.
This is bad.
Surely there is help out there. ISO/IEC 27001 is the information security management framework.
We should be able to use this to help us evaluate the likelihood of an event...right?
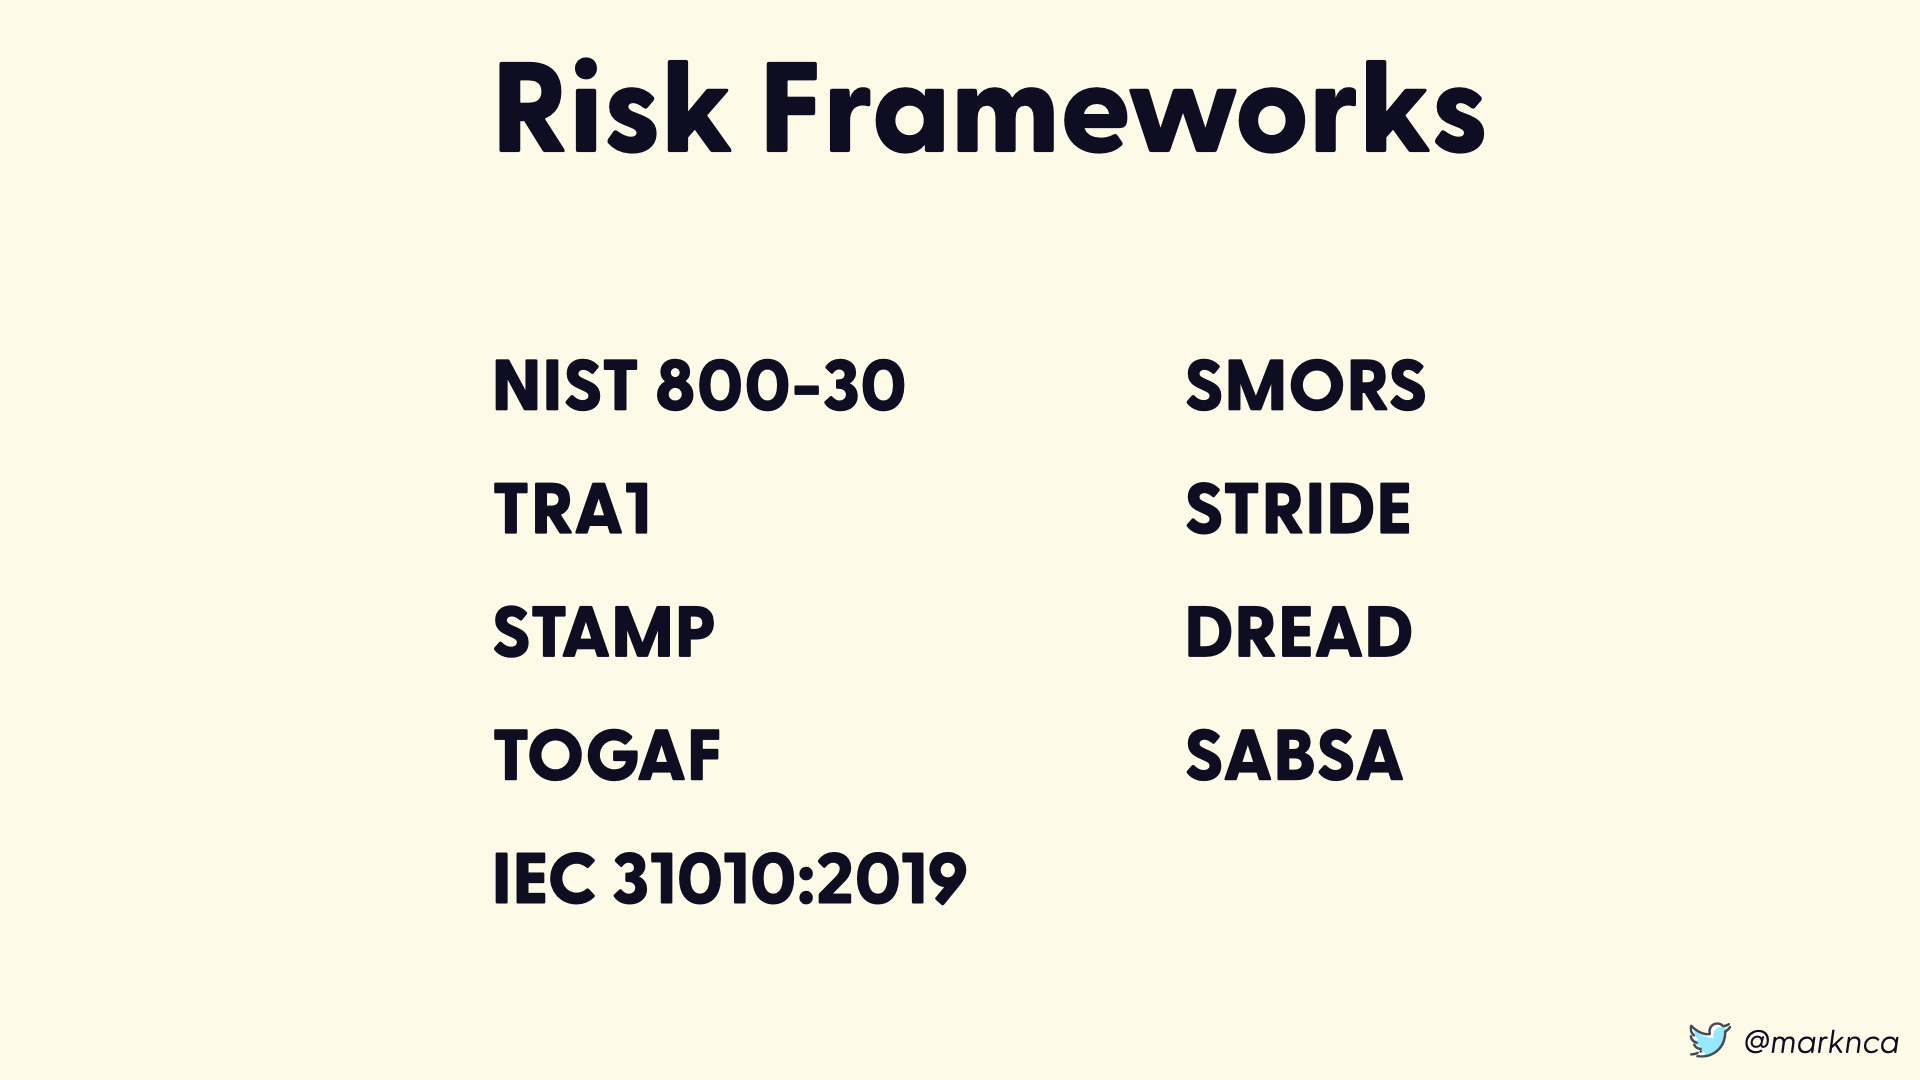
Sadly, ISO/IEC 27001 only states that you must use a risk framework to evaluate and assess risk. So let's examine the available risk frameworks...
There are a ton—and this isn't a comprehensive list—and they are all solid.
Unfortunately, all of these frameworks focus exclusively on assessing the impact of events.
They leave the likelihood to you.
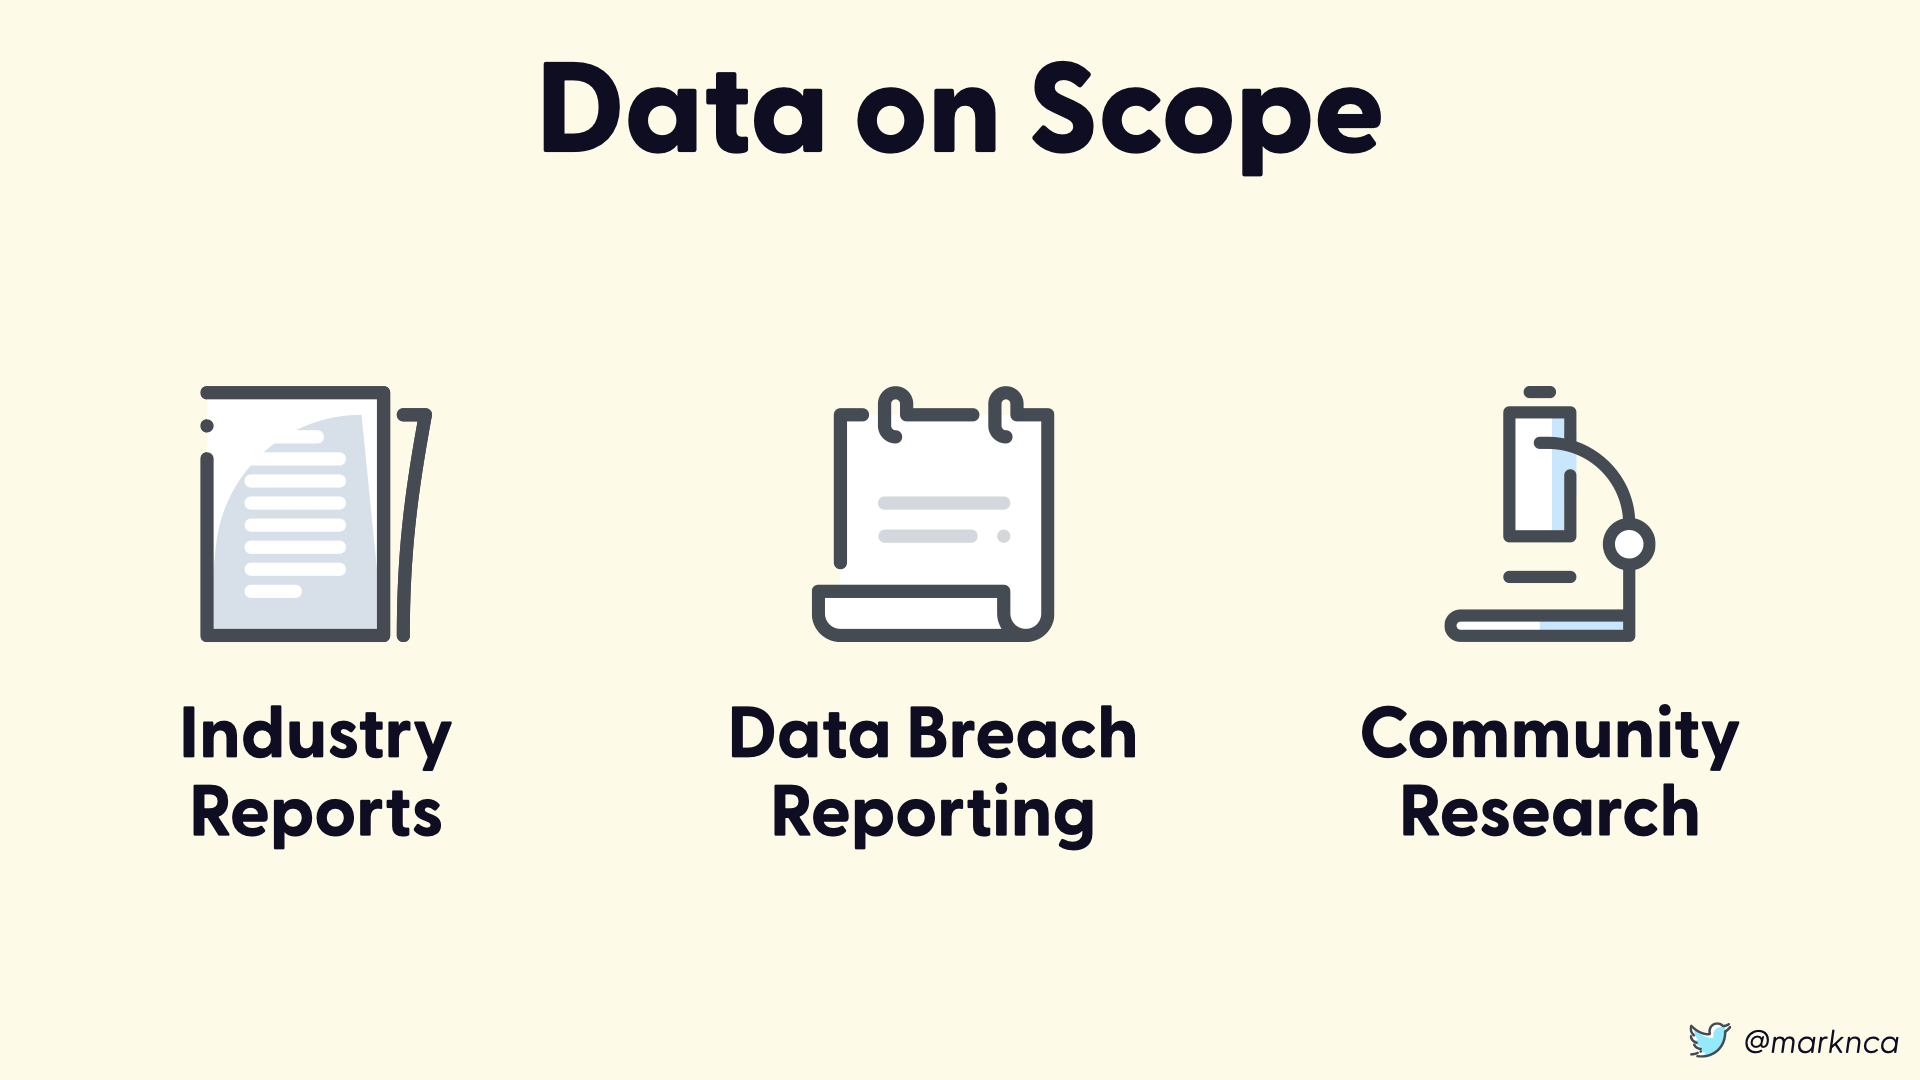
There are some accessible sources out there for data on scope and likelihood.
The challenge is that if you find one specific to your event, it's probably well after the fact. That means you're going to be using historical data as a predictor of future behaviour.
This is bad...but maybe better than nothing?
You also have data source locally that might help.
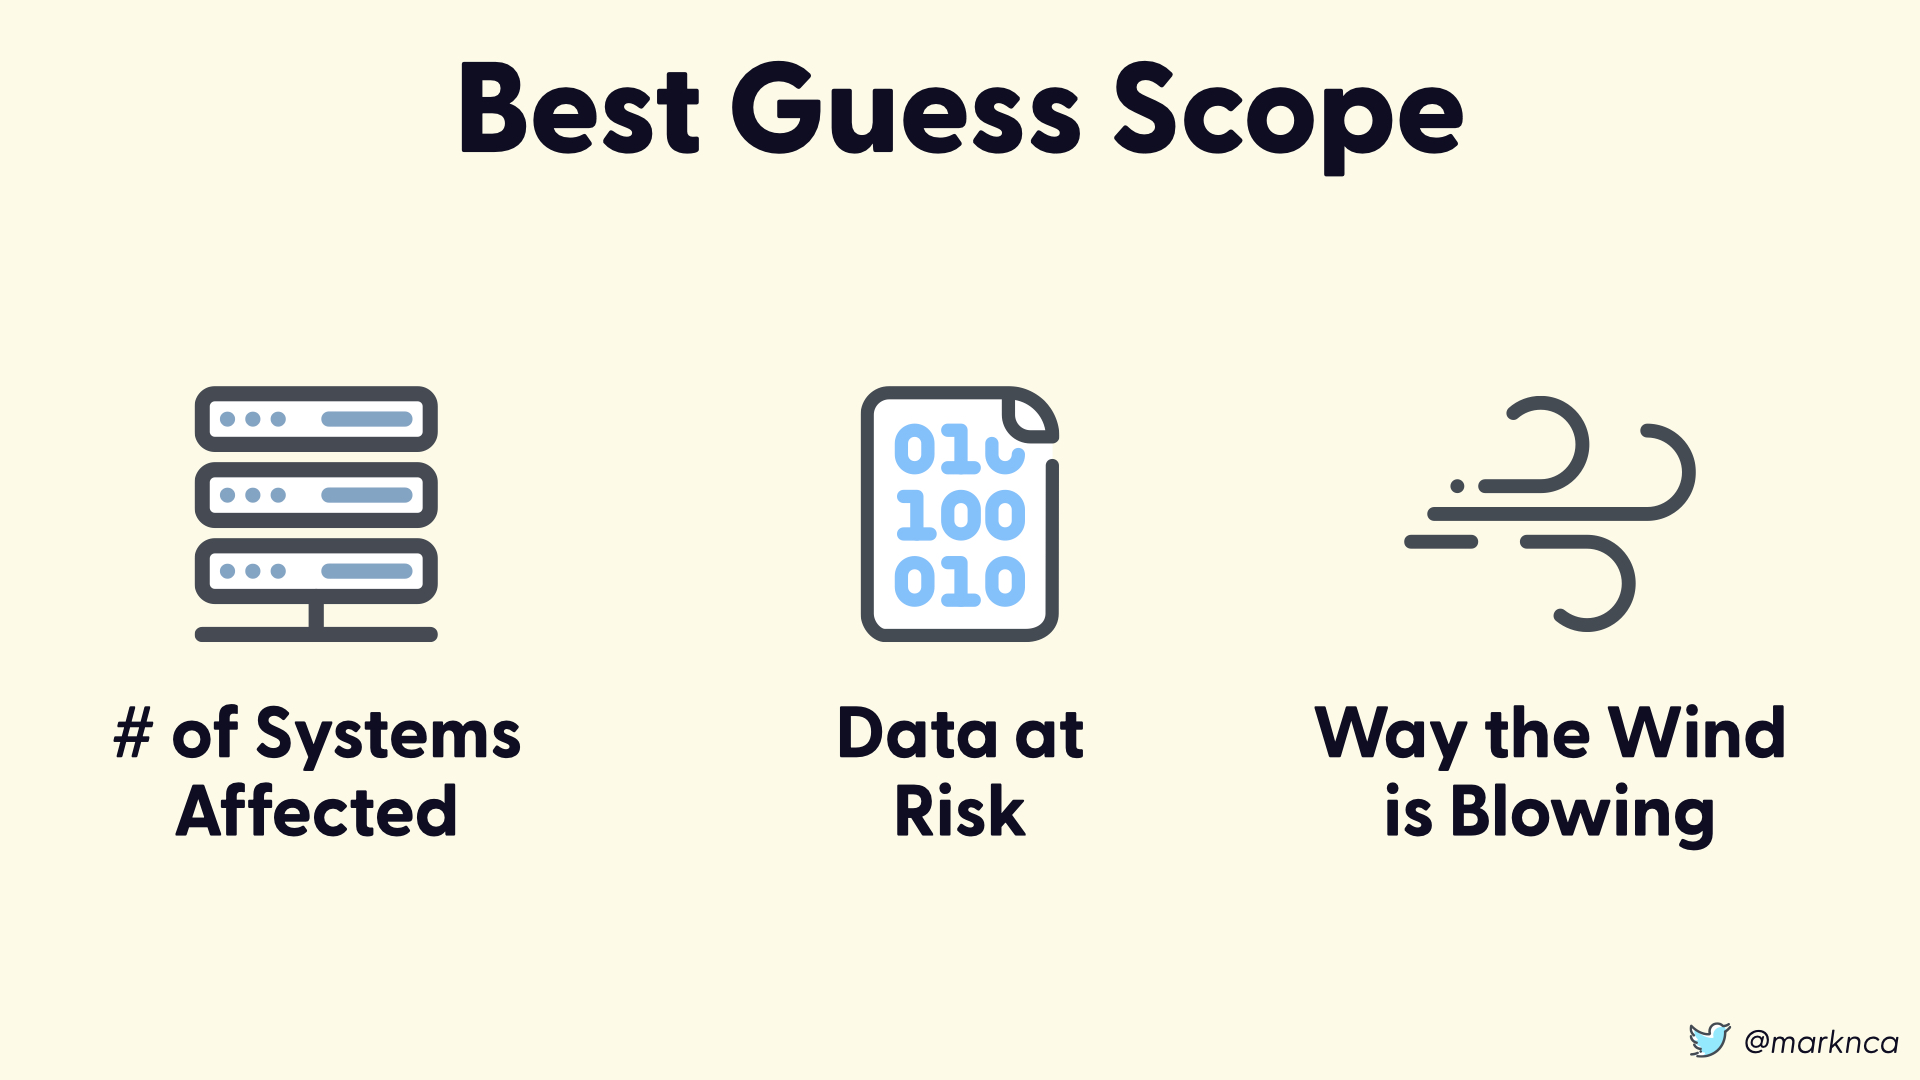
The number of systems that may be affected is a good place to start. If you're analyzing an issue like CVE-2020-0796 and don't have any Windows servers, you don't have to take any actions!
Additionally understanding the value of the data at risk on affected systems will help scope your risk decision.
Beyond that, it's a lot of guess work. As a scientist, I don't like saying that but there it is.
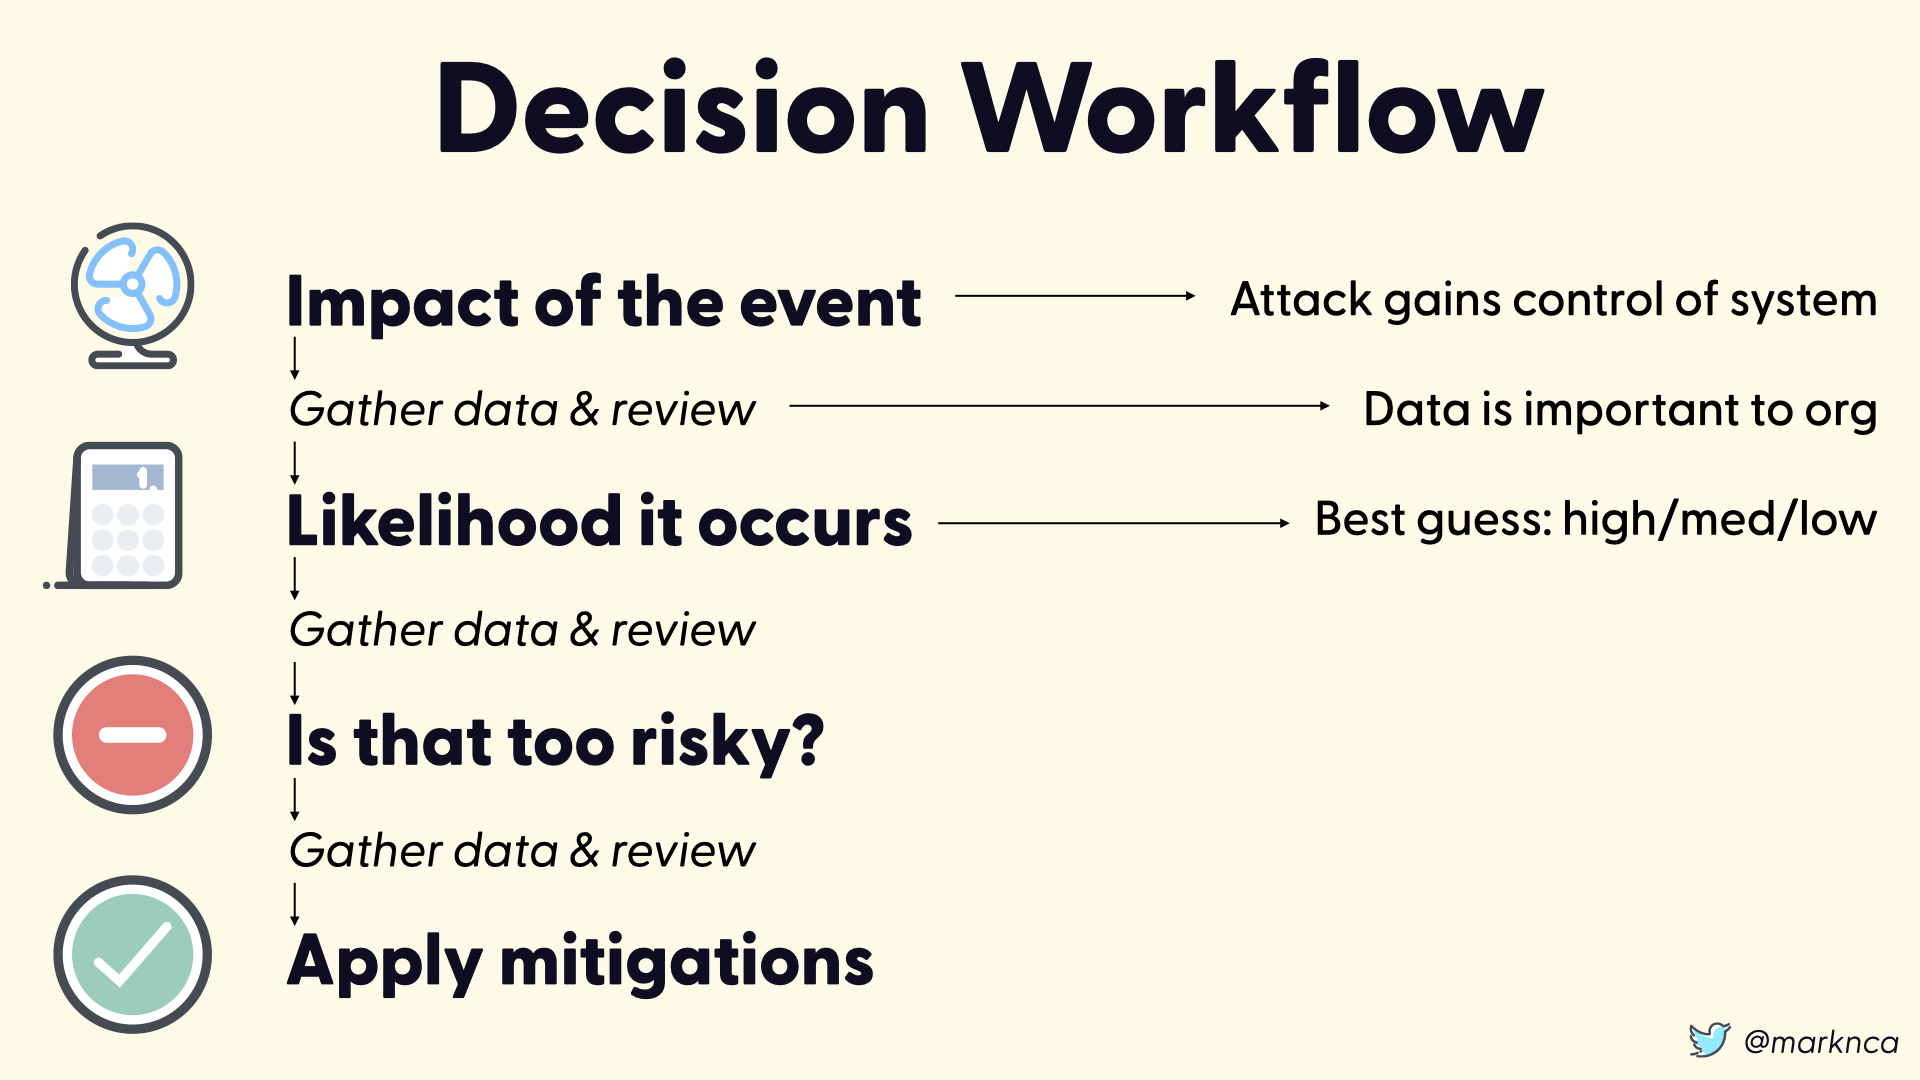
The result? The second of our two factors for a risk decision boils down to a guess of high/medium/low.
This is bad.

Moving Forward
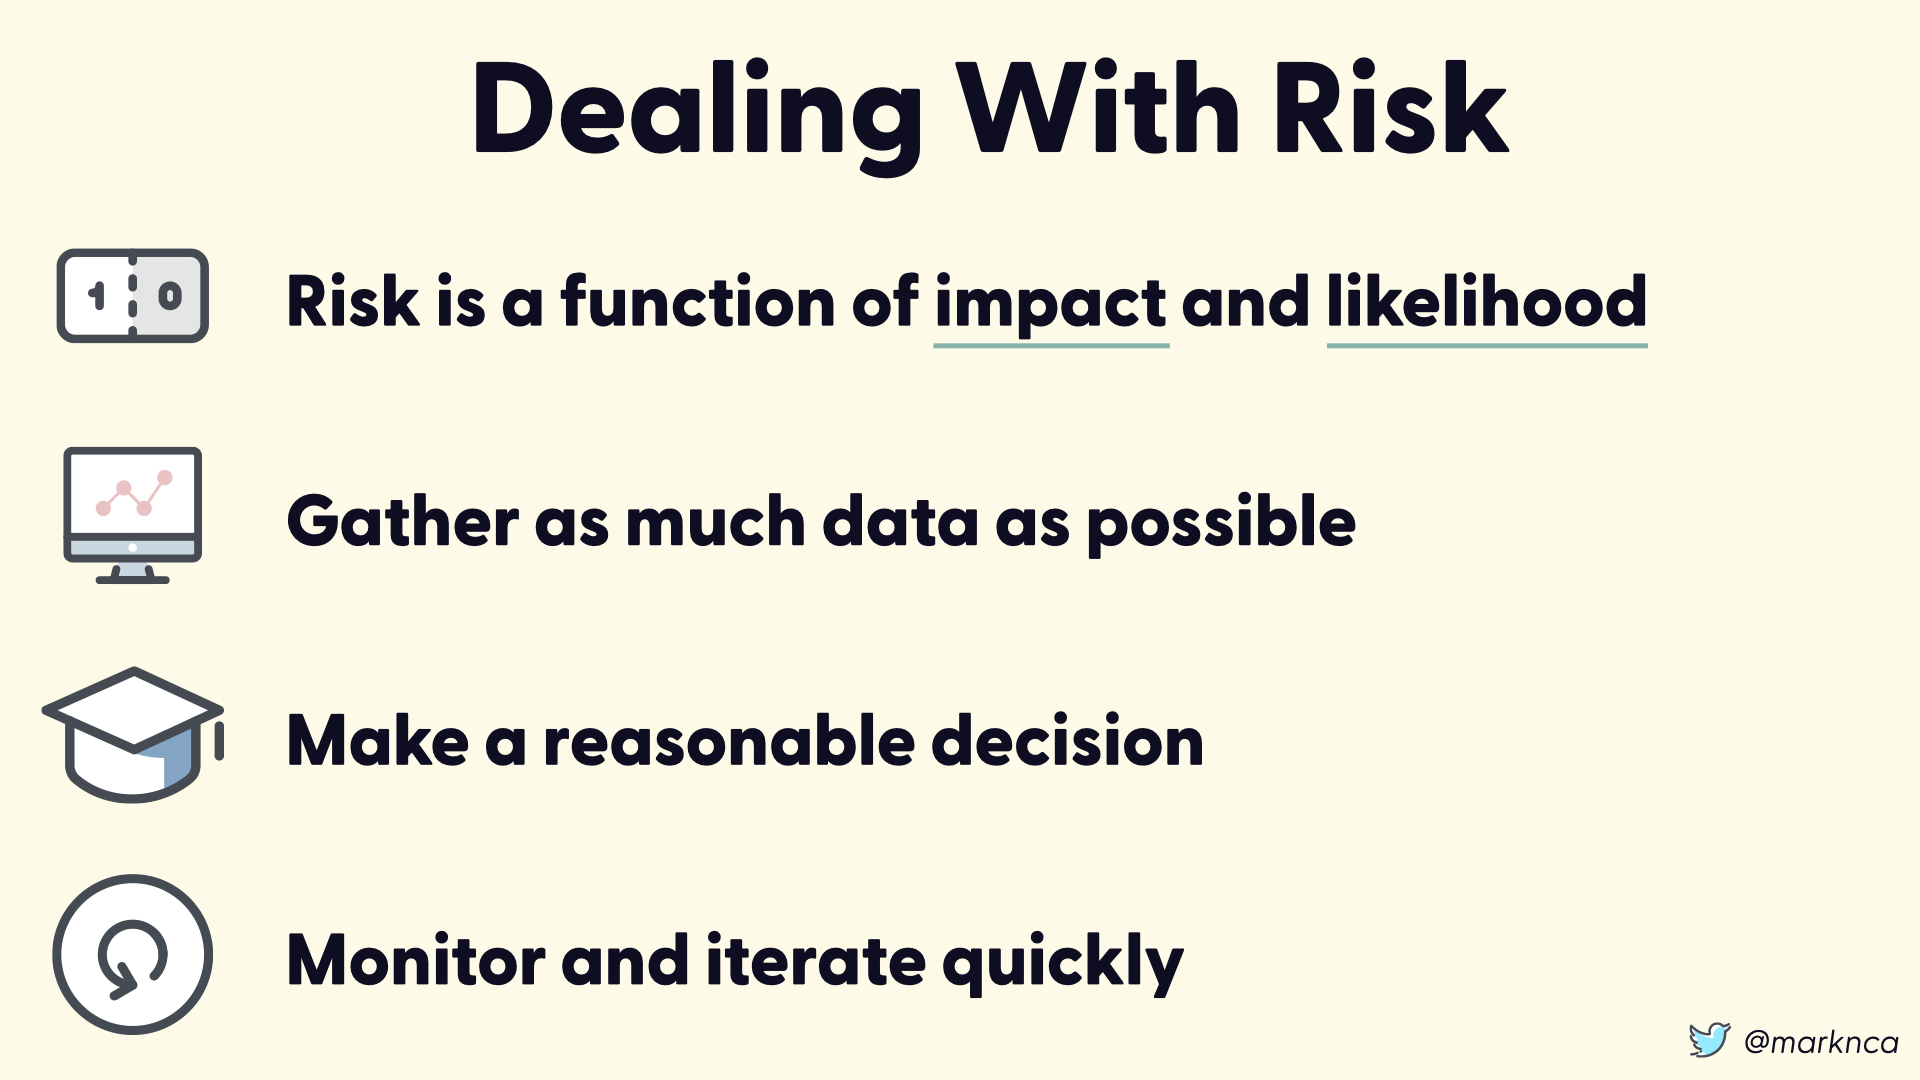
Remember that risk is function of both impact and likelihood. You need an reasonable assessment of both to make a solid decision.
Gather as much data as possible. Accept that it won't be perfect but do your best.
You're going to have to make a decision at some point. Make the best one you can with the information you have at the time.
Monitor the results and impact of that decision and be ready to iterate quickly. You will get better data over time, let that inform future rounds of decisions.

References
Risk Frameworks
- NIST 800-30
- TRA1
- Nancy’s Leveson’s STAMP
- SMORS
- STRIDE
- DREAD
- IEC 31010:2019
- TOGAF
- SABSA
Other References
- ISO/IEC 27001
- How an unpatched Microsoft vulnerability leaked inadvertently, and what it means for Windows Server security, by Christopher Budd for GeekWire. Details the story behind SMBGhost/CVE-2020-0796
- CVSS details for CVE-2020-0796
- Brook Schoenfield and Damian Quiroga from McAfee Labs on the challenges of using CVSS for risk assessments
- The CVSS 3.1 specification
- The 2019 Verizon DBIR
- An actually reasonable explanation of risk from the UK’s National Cyber Security Centre